
Figure 3. Behavioral decoding reveals sensorimotor strategies.
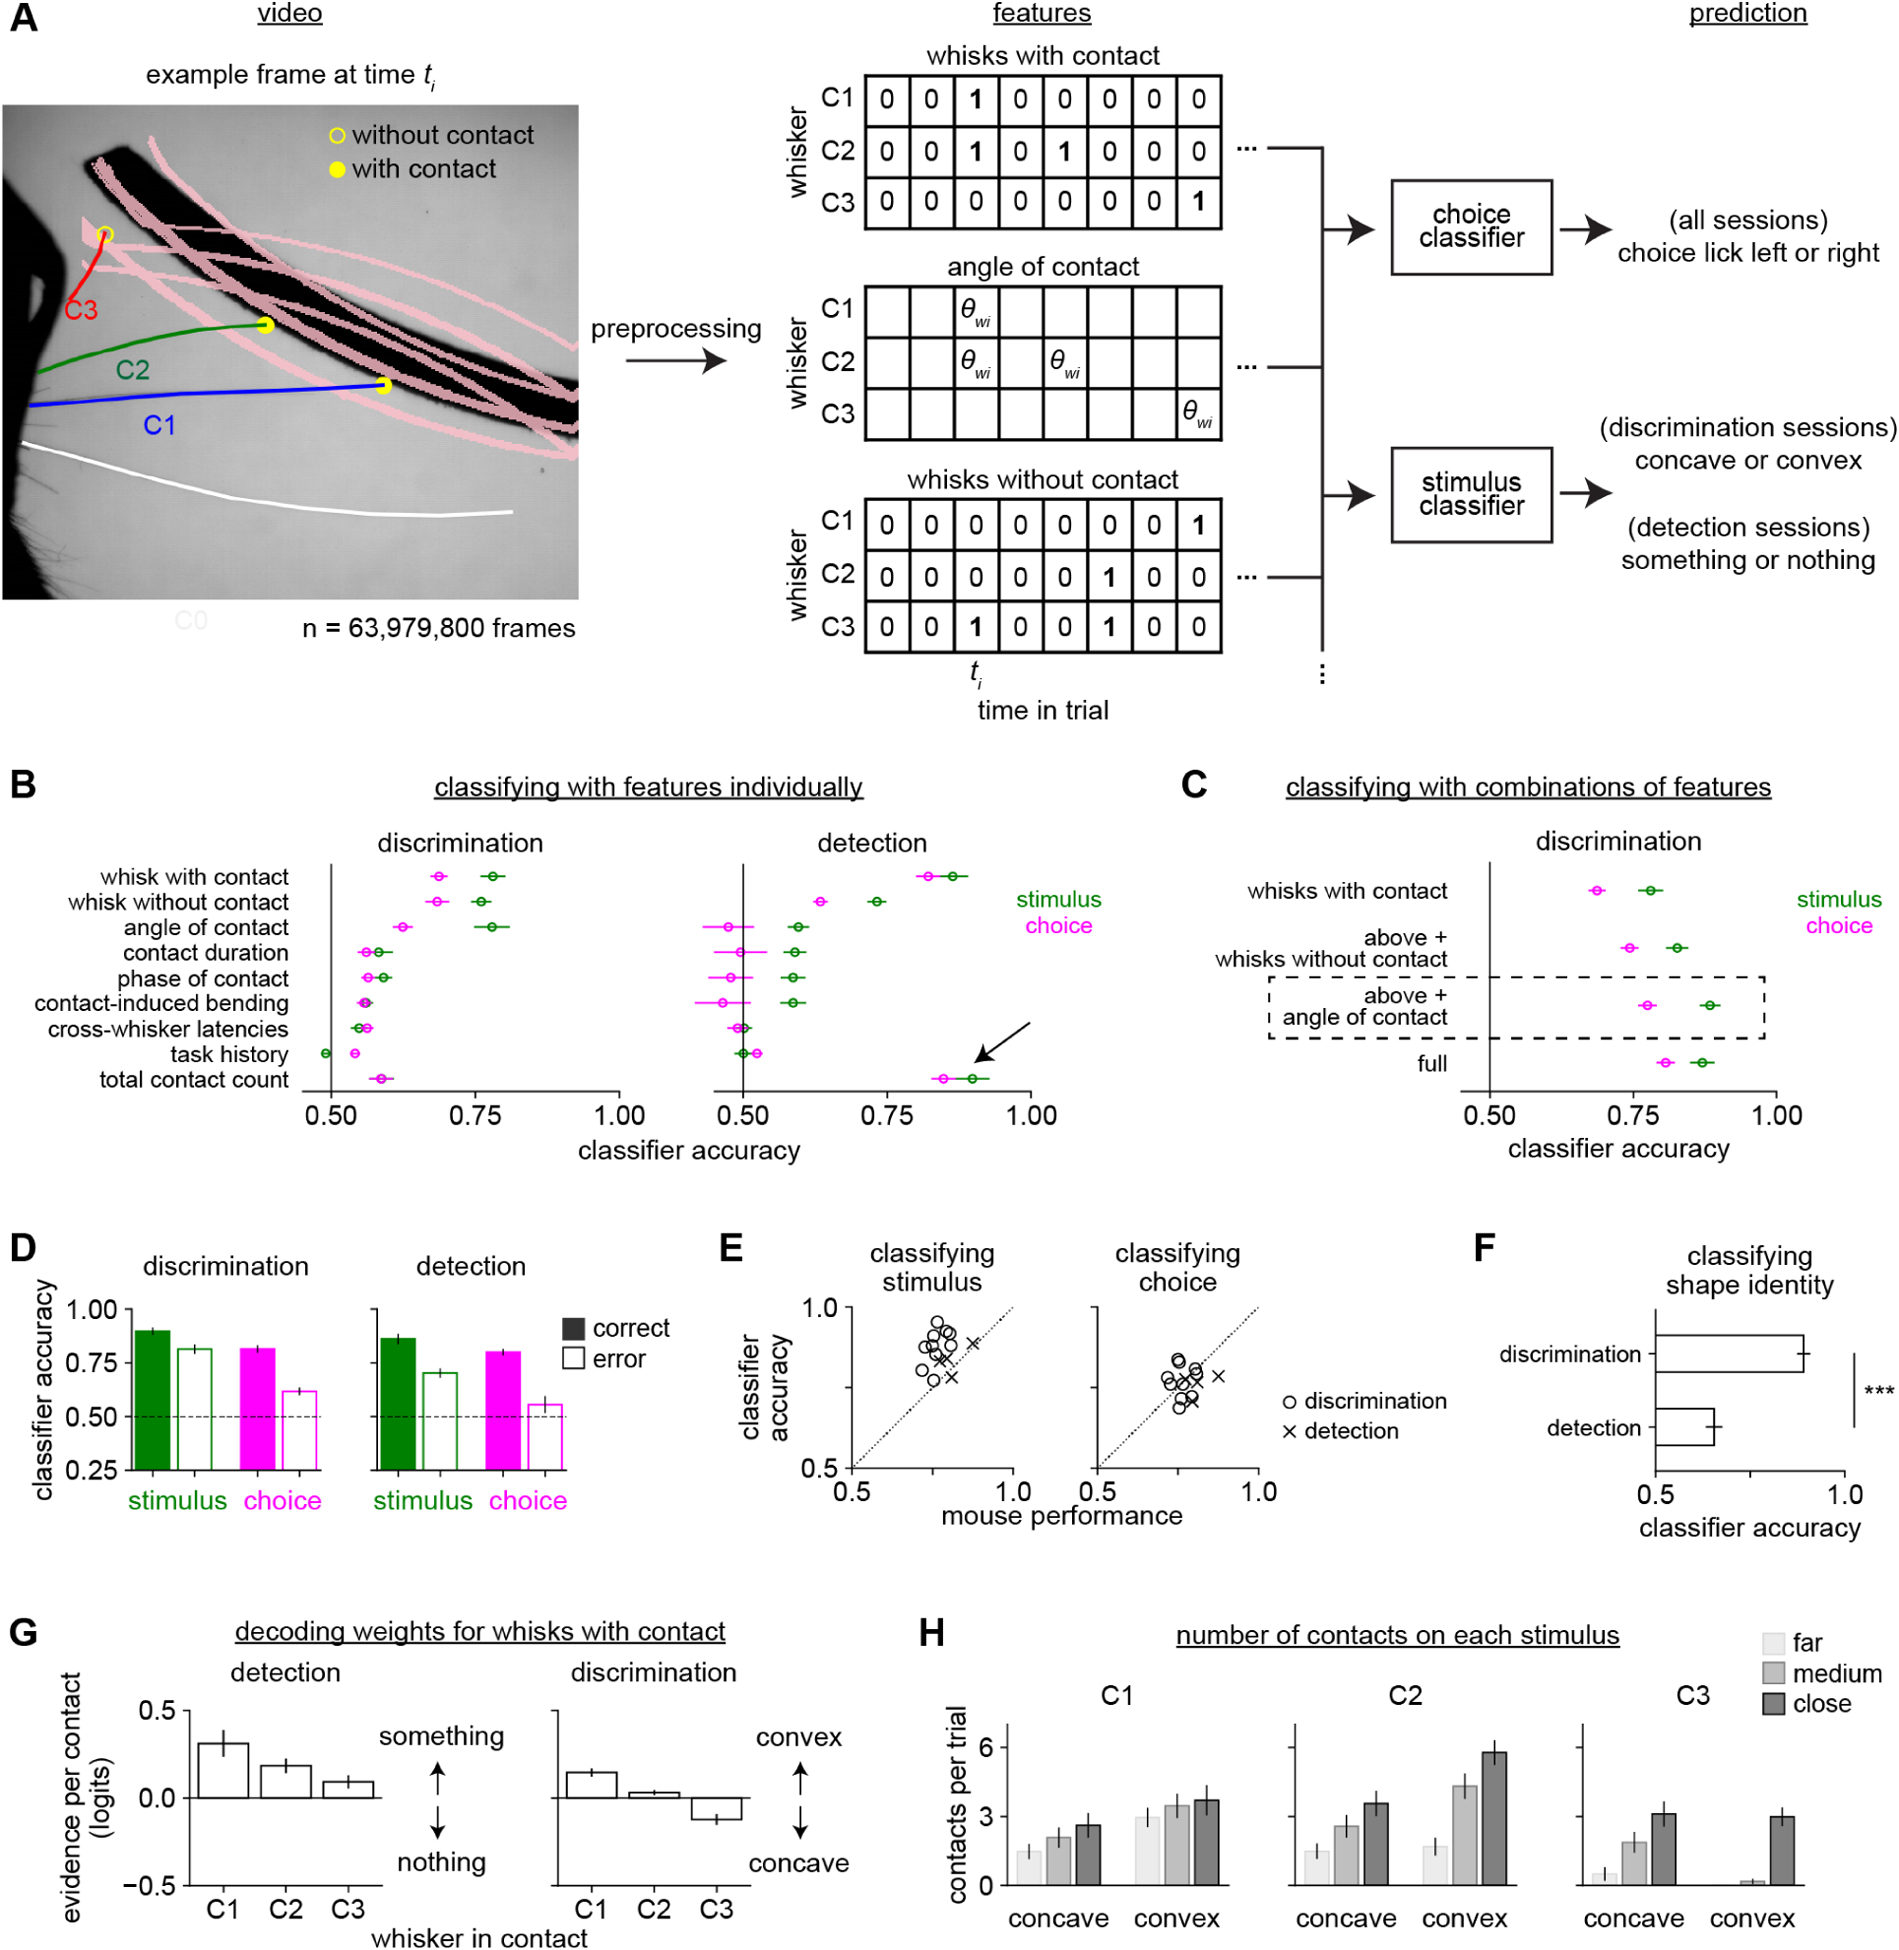
A) Behavioral decoding. We used 31 contact, whisking, and task-related features (Supplemental Table 1) to predict the stimulus or choice. Left: Example frame showing the peak of a sampling whisk. C1-C3 protracted enough to reach the shapes at some positions (pink lines); C1 and C2 were scored as “with contact” and C3 as “without contact”. Middle: Example features, each an array over whisker (rows) and 250 ms time bins (columns). Example frame in third column. Sampling whisks were binarized as “with contact” or “without contact”. Continuous variables like “angle of contact” were defined only during contact and were otherwise null. Right: Logistic regression classifiers predicted stimulus or choice.
B) Accuracy of behavioral decoders trained on a single feature to identify stimulus (green) or choice (pink). During shape detection (right), the total number of contacts (black arrow) was the most informative feature, but was much less useful during discrimination.
C) Features were combined in a stepwise fashion to create a simple model that captured behavior. Shown is the accuracy of decoders trained on 1) whisks with contact only, 2) also including whisks without contact, 3) also including angle of contact, 4) including all features in the entire dataset. The third model (dashed box, “optimized behavioral decoder”) performs as well as the full model while using far fewer features.
D) The optimized behavioral decoder predicts stimulus and choice well during both shape discrimination and detection, though less accurately when the mouse made an error (open bars).
E) Accuracy of the decoder at identifying stimulus and choice versus the performance of each mouse.
F) The decoder more accurately predicted shape identity for mice performing shape discrimination than detection. Unpaired t-test.
G) The weights assigned by the decoder to the “whisks with contact” feature, separately plotted by which whisker made contact. Weights were relatively consistent over the trial time course (data not shown) and are averaged over time here for clarity. They are expressed as the change in log-odds (logits) per additional contact.
H) The mean number of contacts per trial for each whisker during shape discrimination, separately by shape identity and position (cf. Fig 1B). Although each whisker may contact one shape more frequently, no whisker touches a single shape exclusively.
Error bars: SEM over mice. n = 10 shape discrimination mice and 4 shape detection mice. Behavioral decoding requires error trials and one detection mouse made too few errors to be included.