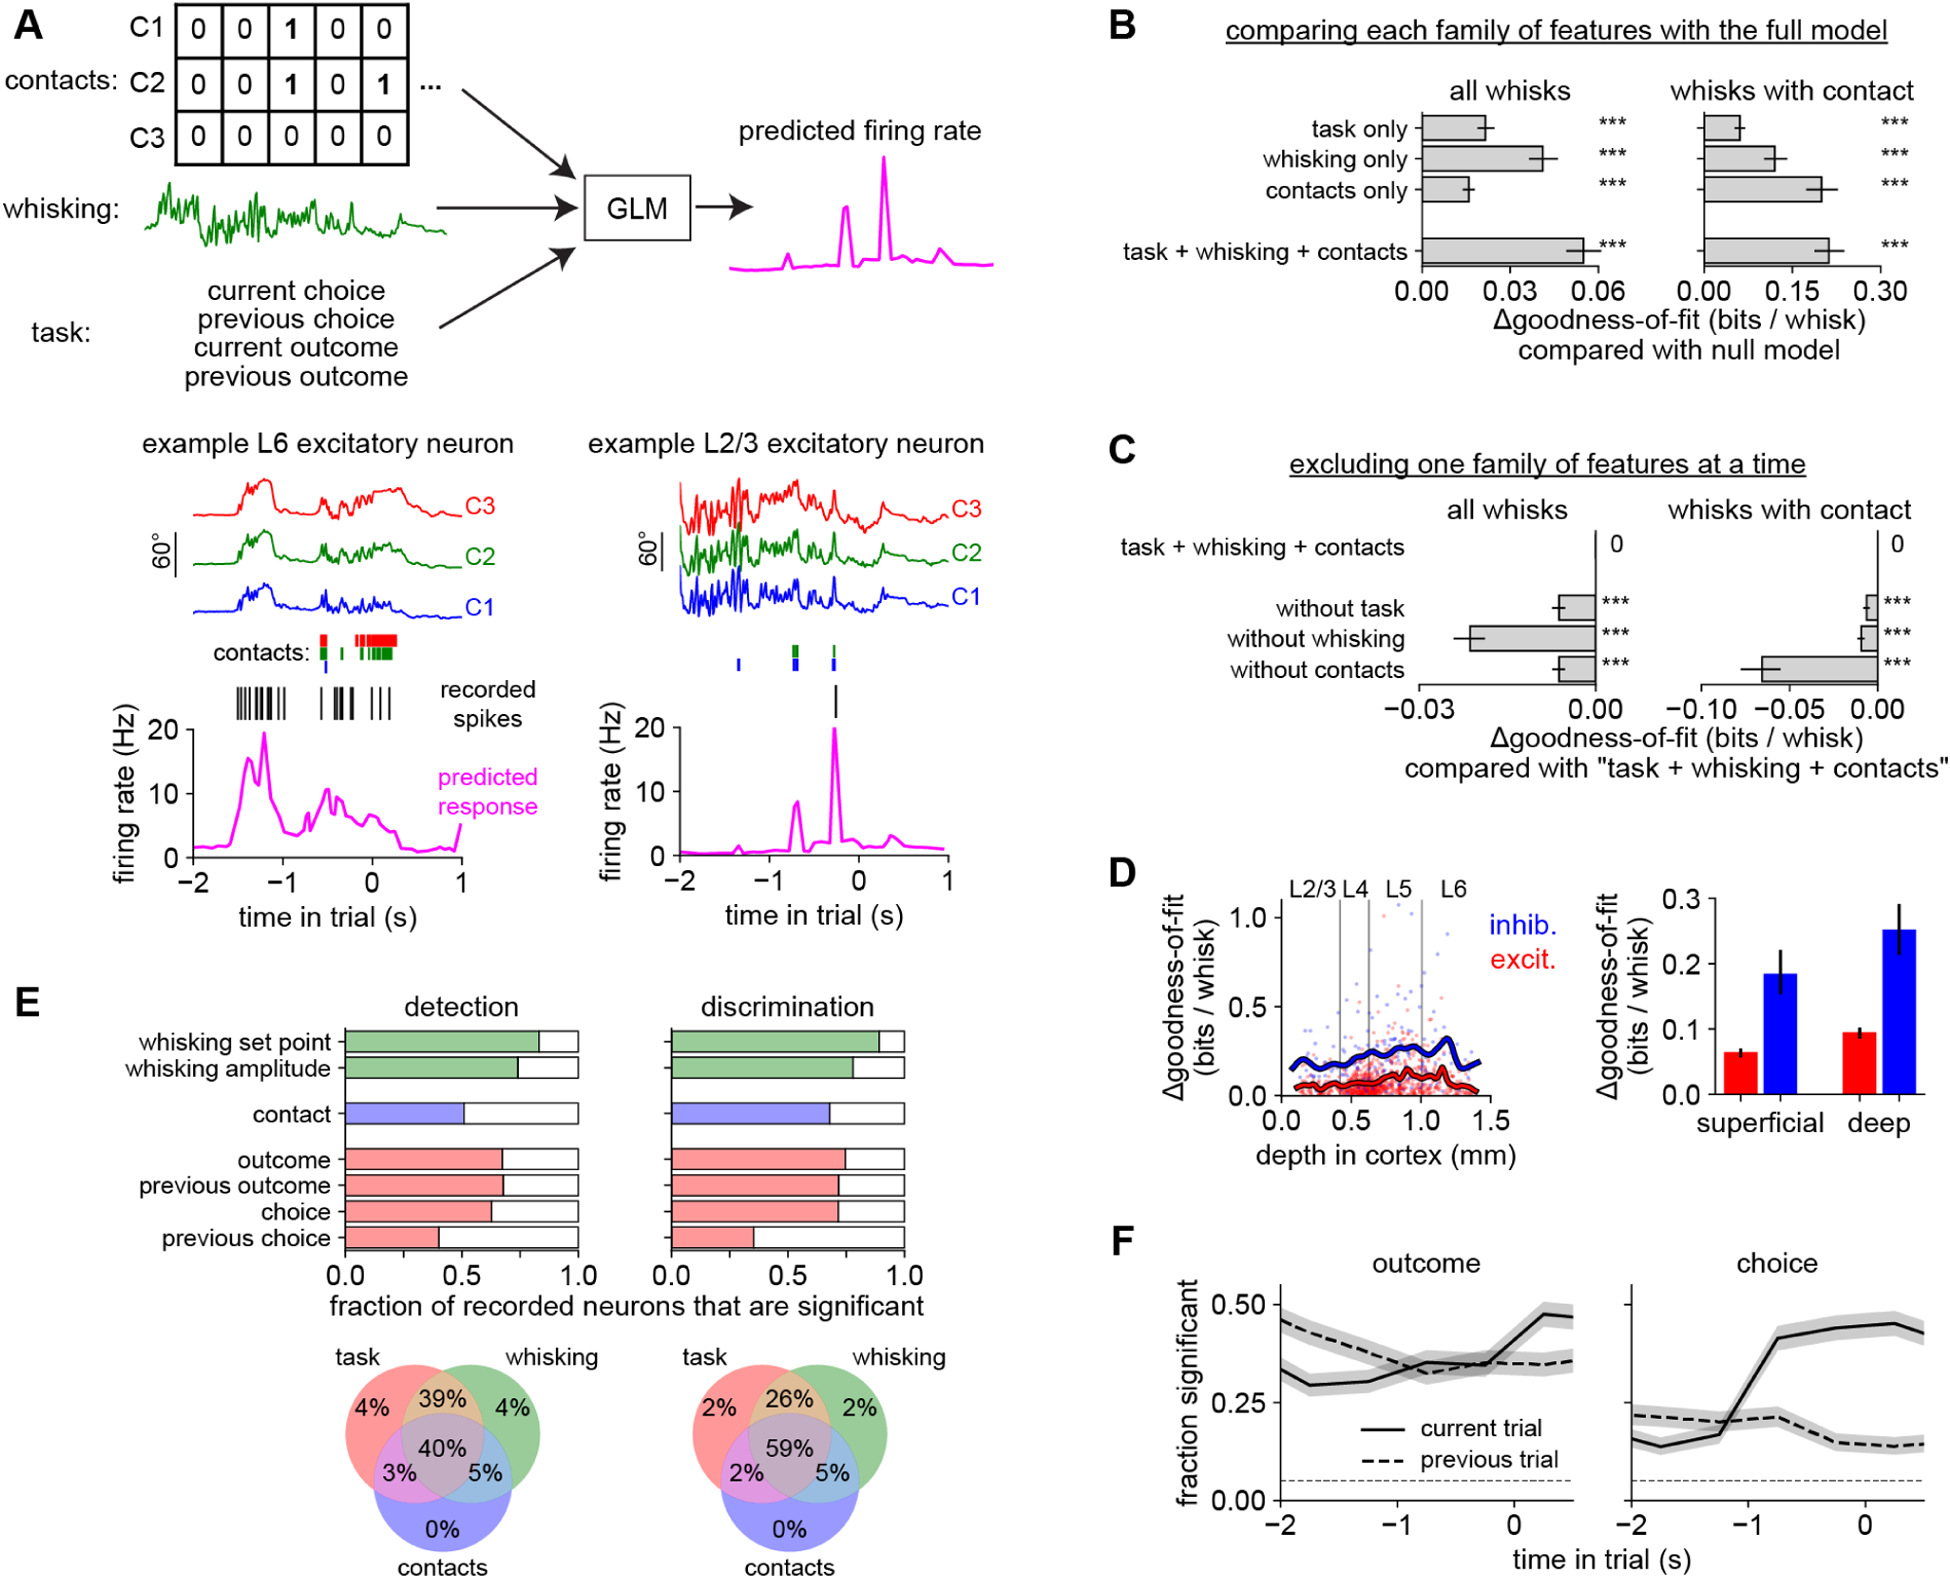
Figure 7. Distributed coding in barrel cortex.

A) A GLM used features about contacts (whisker identity), whisking (amplitude and set point), and task (choice and reward history) to predict neural responses on individual whisk cycles. Bottom left: Predicted firing rate (pink) for an example neuron (black raster: recorded spikes) given the position of each whisker (colored traces) and contacts (colored bars). This L6 neuron mainly responded to whisking, regardless of contacts. Bottom right: This L2/3 neuron mainly responded to contacts regardless of whisking. Models were always evaluated on held-out trials.
B) The goodness-of-fit (ability to predict neural responses) of the GLM using features from the task, whisking, or contact families. Each feature family significantly improves the log-likelihood over a null model that used only information about baseline firing rate (p < 0.001, Wilcoxon test). The full model (“task + whisking + contacts”) outperforms any individual feature family. Similar results are obtained when testing on the entire dataset (left) or only on whisks with contact (right).
C) The effect on goodness-of-fit of leaving out one family at a time from the full “task + whisking + contacts” model.
D) Goodness-of-fit versus cortical depth (left) and grouped by cell type (right) in the “task + whisking + contacts” model.
E) Top: Proportion of neurons that significantly (p < 0.05, permutation test) encoded each variable during each task. Bottom: Venn diagram showing percentage of neurons significantly encoding features from task (red), whisking (green), and contact (blue) families during each task. <1% of neurons did not significantly encode any of the features.
F) Proportion of neurons significantly modulated by the outcome or choice of the previous (dashed) or current (solid) trial. Timescale as in Fig 1H.
n = 301 neurons during shape detection and 675 neurons during shape discrimination, pooled in panels B–D and F because the results were similar. Error bars: 95% confidence intervals, obtained by bootstrapping (B–D) or Clopper-Pearson binomial (F).
