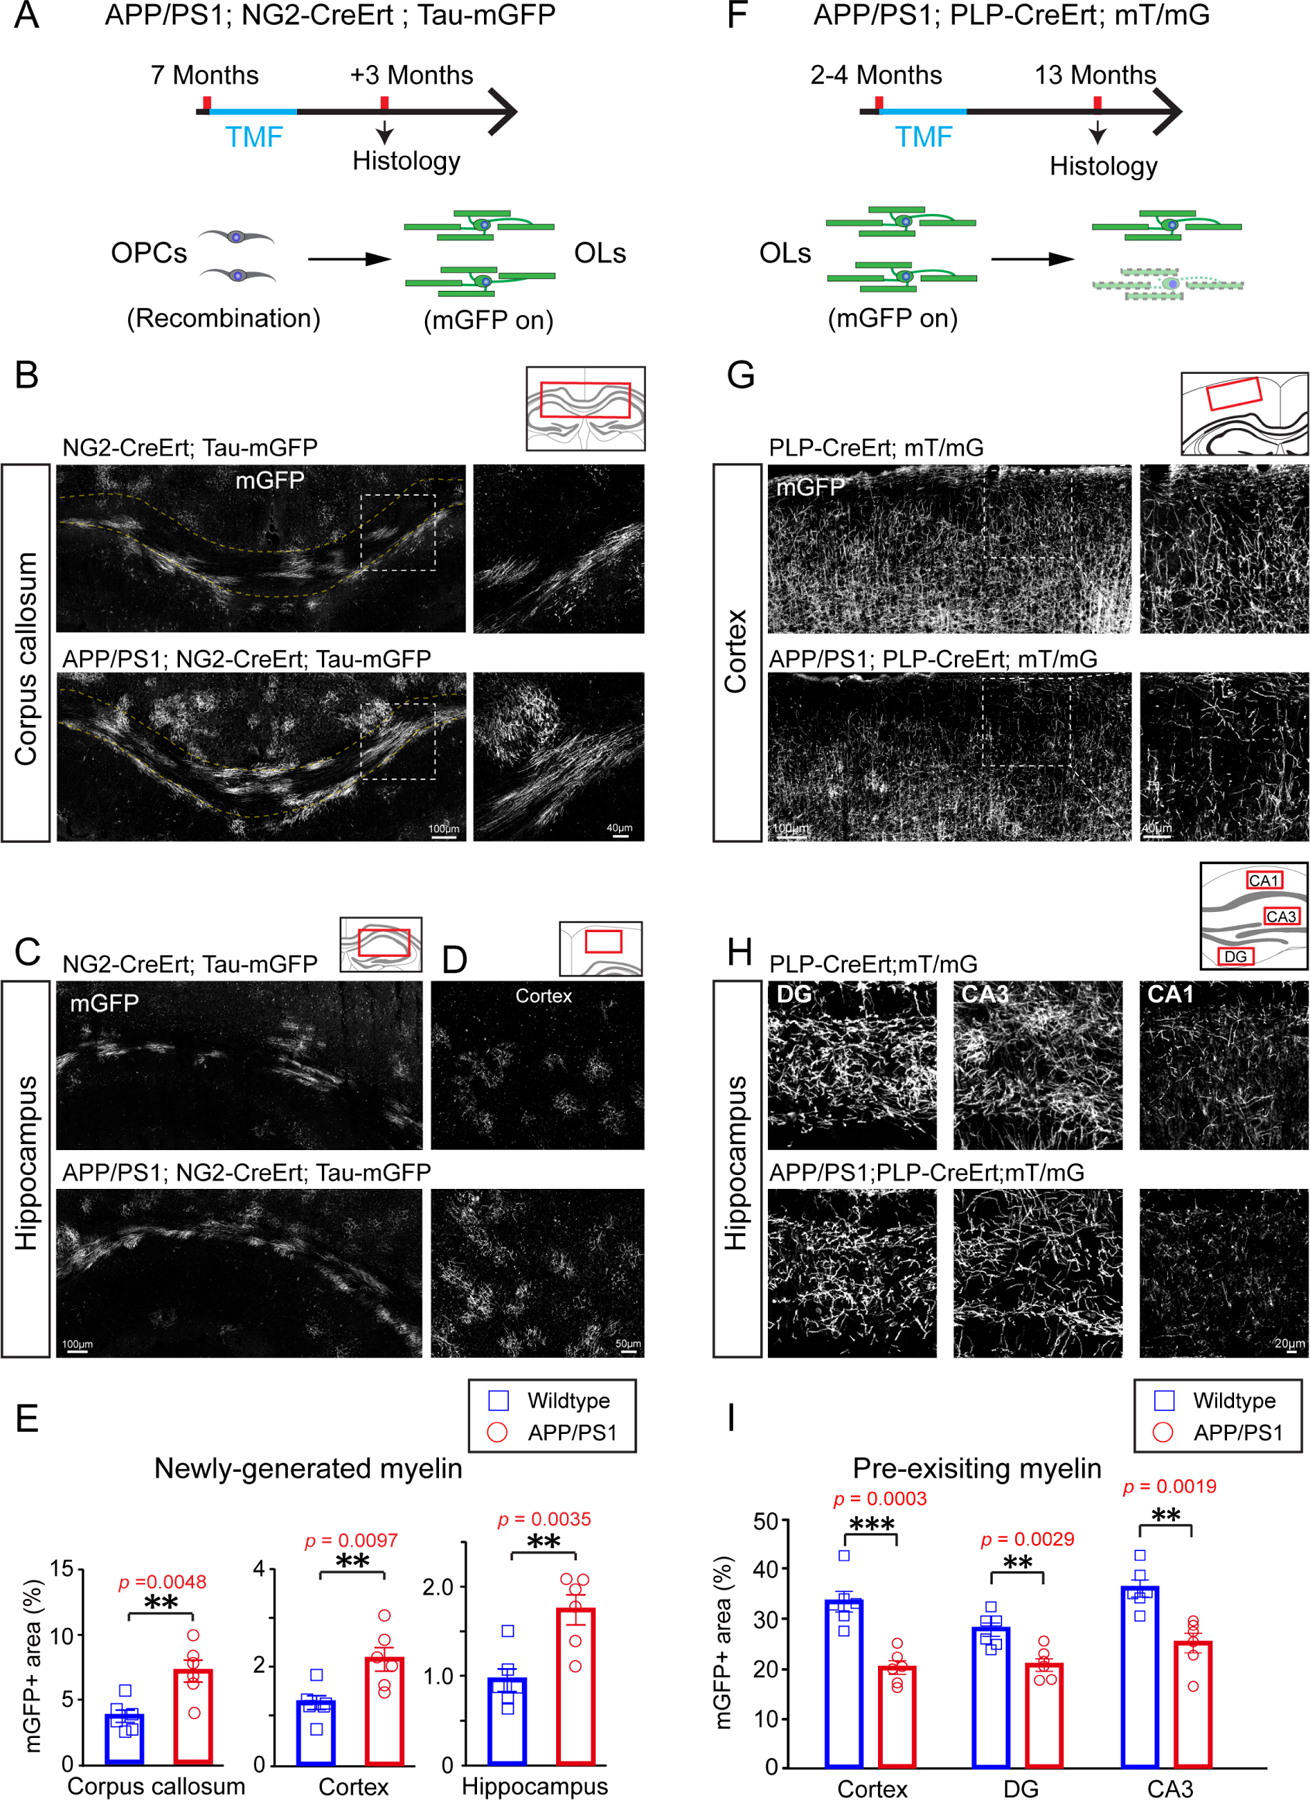
Figure 1. New myelin formation and degeneration are both elevated in APP/PS1 mice.

(A) Schematic illustration showing the time course for tamoxifen induction and histology in the APP/PS1;NG2-CreERT;Tau-mGFP mice. (B-D) Confocal images of mGFP positive myelin (gray) in the corpus callosum (B), hippocampus (C) and cortex (D) of APP/PS1 mice and littermate controls. Magnified images (right panels) showing the dotted areas in the left panels in B. Scale bars, 100μm (left panels of B, C), 40μm (right panels of B) and 50μm (D). (E) Quantification of mGFP positive myelin in the corpus callosum, hippocampus and cortex of APP/PS1 mice and littermate controls. n=6 biologically independent mice for each group, two-tailed unpaired t-tests were used; (F) Schematic illustration displaying the time course for tamoxifen induction and histology in the APP/PS1;PLP-CreERT;mT/mG mice.(G and H)Representative images of mGFP positive myelin (gray) in the cortex (G)and hippocampus (H) of APP/PS1 mice and littermate controls. Scale bars, 100μm (left panels of G), 40μm (right panels of G), 20μm (H). (I) Quantification of mGFP positive myelin areas in the cortex and hippocampus of APP/PS1 mice and littermate controls. n=6 biologically independent mice for each group, two-tailed unpaired t-tests were used; Error bars are presented as mean ± s.e.m. *p<0.05, **p<0.01, ***p<0.001. See also Figure S1 and Table S1.
