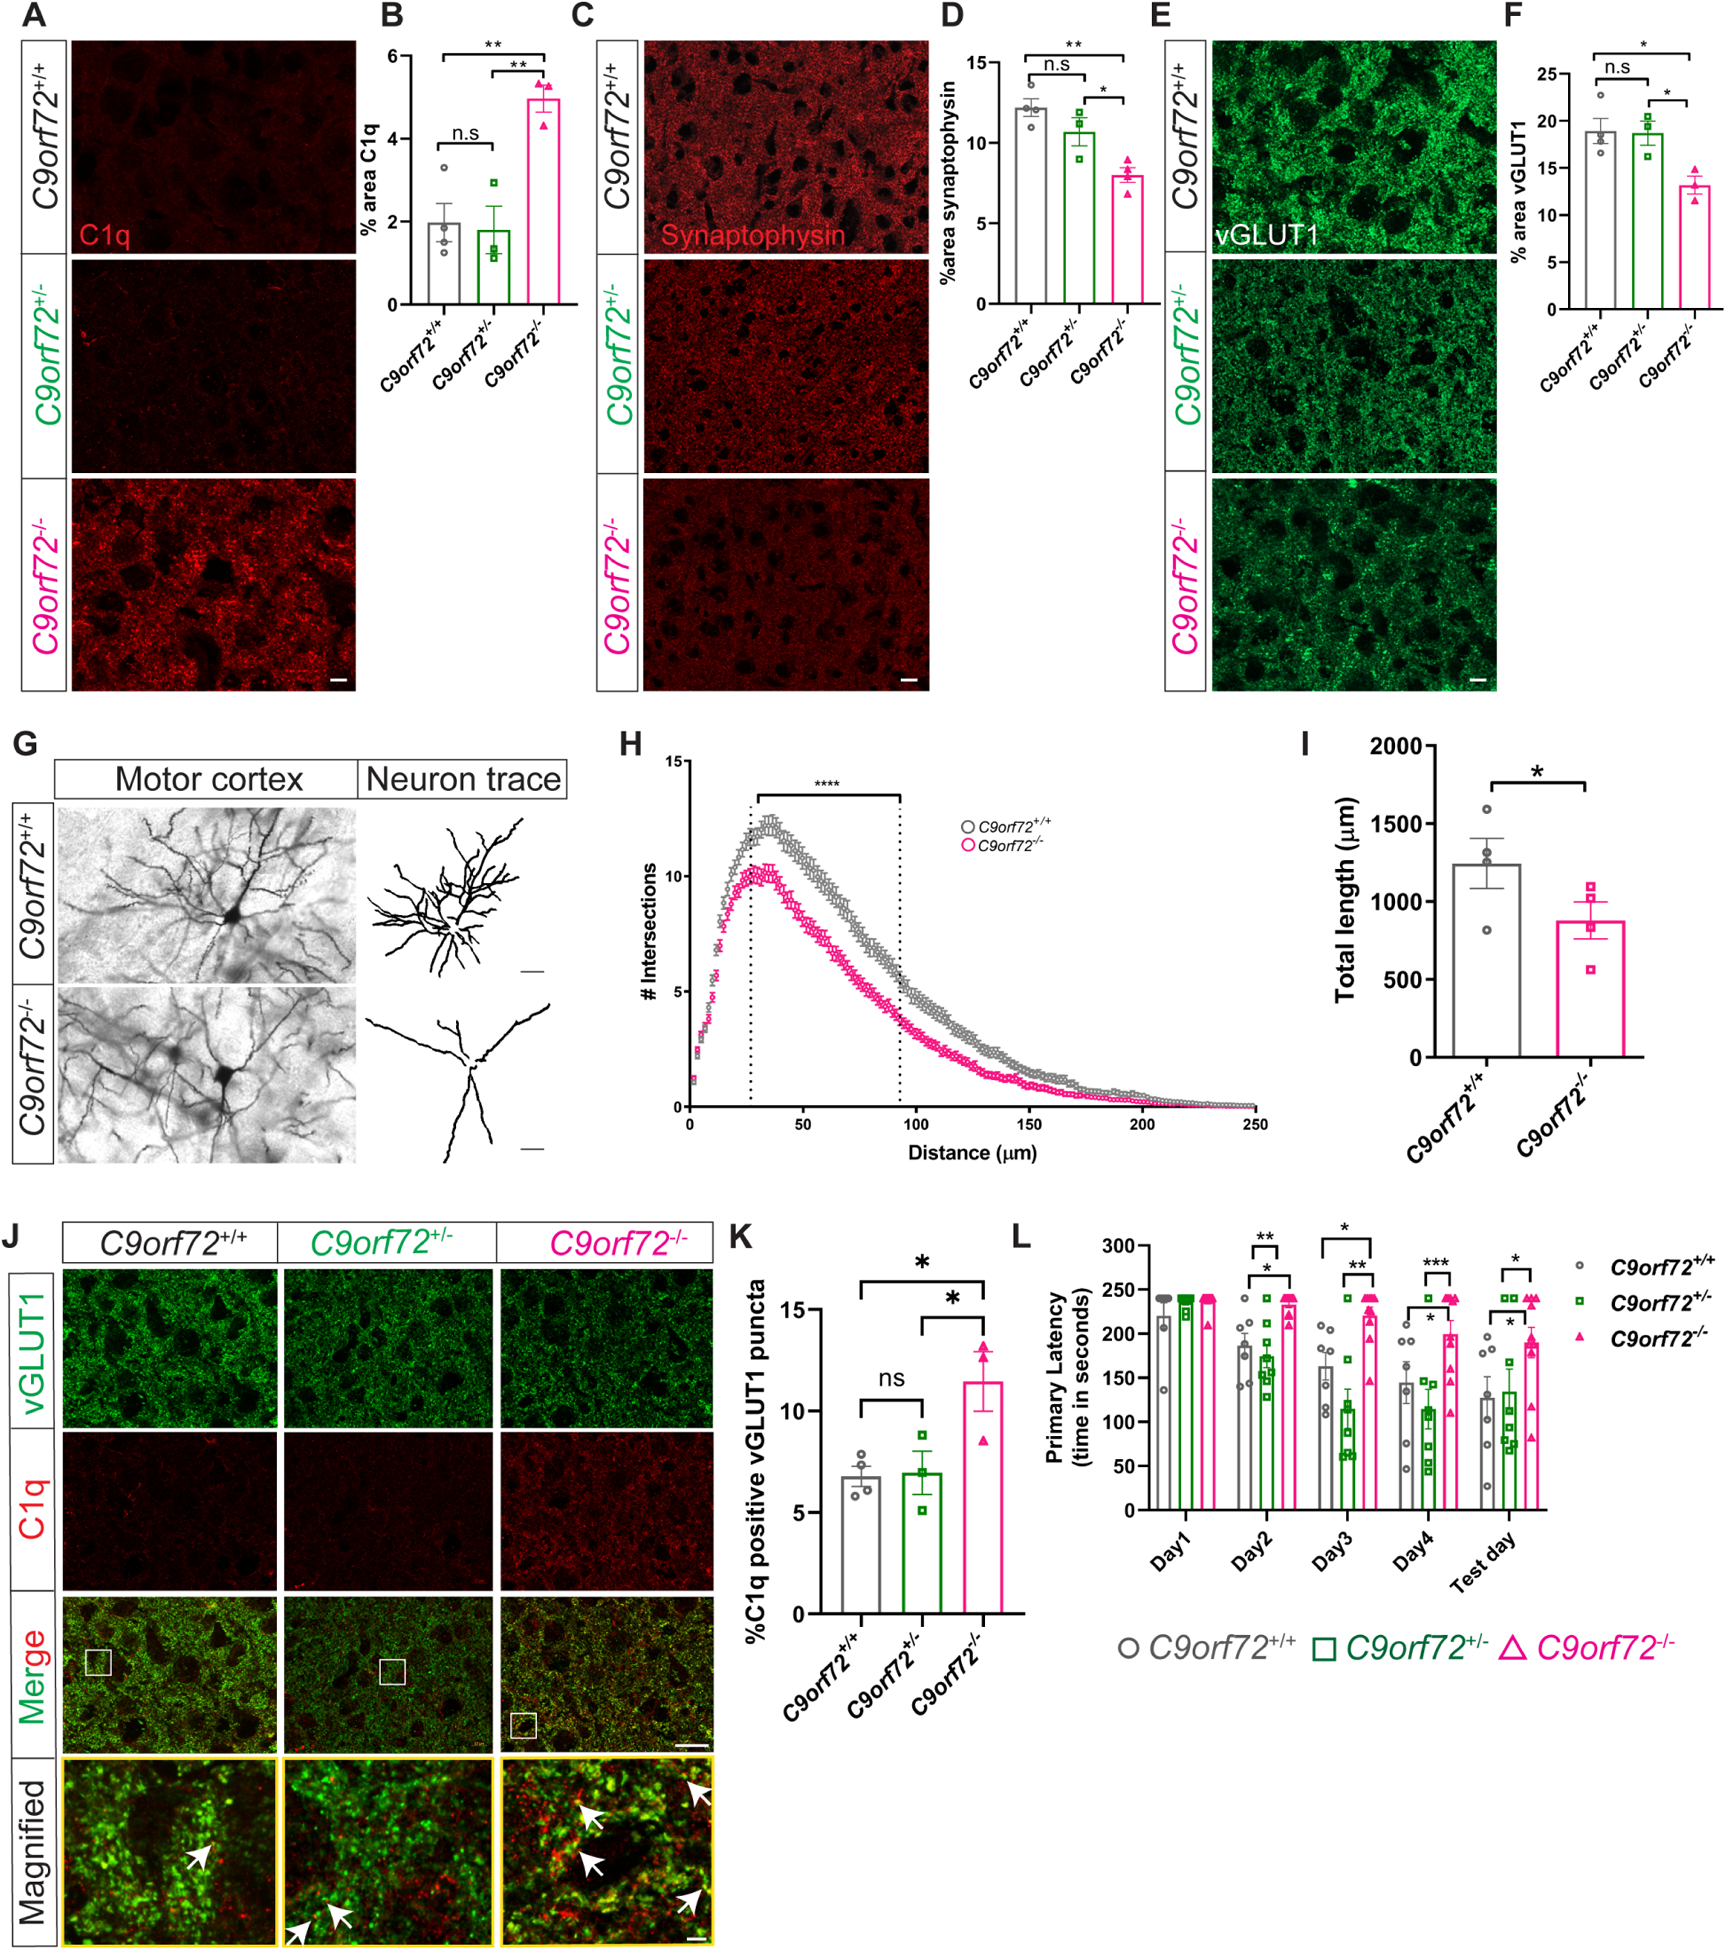
Figure 2: Synaptic and behavioral defects in aged C9orf72−/− mice.

(A) Representative images of C1q immunoreactivity in the motor cortex of C9orf72+/+, C9orf72+/−, and C9orf72−/− mice at 12 months and (B) quantification. mean ±SEM, One-way ANOVA with Tukey’s multiple comparison test, n=3–4 per genotype, **p<0.005. (C) Motor cortex from 12-month-old C9orf72+/+, C9orf72+/−, and C9orf72−/− mice immunostained with synaptophysin and (D) quantification, mean ±SEM, One-way ANOVA with Tukey’s multiple comparison test, n=3–4 per genotype, *p<0.05, **p<0.005. (E) Representative confocal images of vGLUT1 immunoreactivity from 12-month-old C9orf72+/+, C9orf72+/−, and C9orf72−/− mice and (F) quantification. mean ±SEM, One-way ANOVA with Tukey’s multiple comparison test, n=3–4 per genotype, *p<0.05. Scale bars: 10μm. (G) Neuronal morphology tracings from motor cortex of Golgi stained 12-month C9orf72+/+ and C9orf72−/− mice brains; n=4 per genotype. Scale bars: 20μm. (H) Sholl analysis of dendritic arborization, Ordinary Two-way ANOVA, ****p<0.0001. (I) Total length of the neurites in the indicated genotypes, mean ±SEM, Unpaired t-test, two-tailed, n=4 per genotype, *p<0.05. (J) Representative images of vGLUT1 (green) and C1q (red) proteins in the motor cortex of 12-month C9orf72+/+, C9orf72+/−, and C9orf72−/− mice. Rectangular box indicates magnified region. White arrows indicate vGLUT1 positive puncta either co-localized or next to C1q immunoreactive puncta. Scale bars: 10μm, 5μm. (K) Quantification of C1q positive vGLUT1 puncta, mean ±SEM, One-way ANOVA with Tukey’s multiple comparison test, n=3–4 per genotype, *p<0.05. (L) Barnes maze analysis of primary latency from 12-month-old C9orf72+/+ (n=7), C9orf72+/− (n=8), and C9orf72−/− (n=10) mice. Two-way repeated measure ANOVA with Tukey’s multiple comparison test, time x genotype F(8, 88)=2.075, p=0.0467, time effect: F(3.127, 68.79)=16.14, p<0.0001, genotype effect: F(2, 22)=13.30, p=0.0002, *p<0.05, ***p<0.0005, ****p<0.0001. See also Figure S3.
