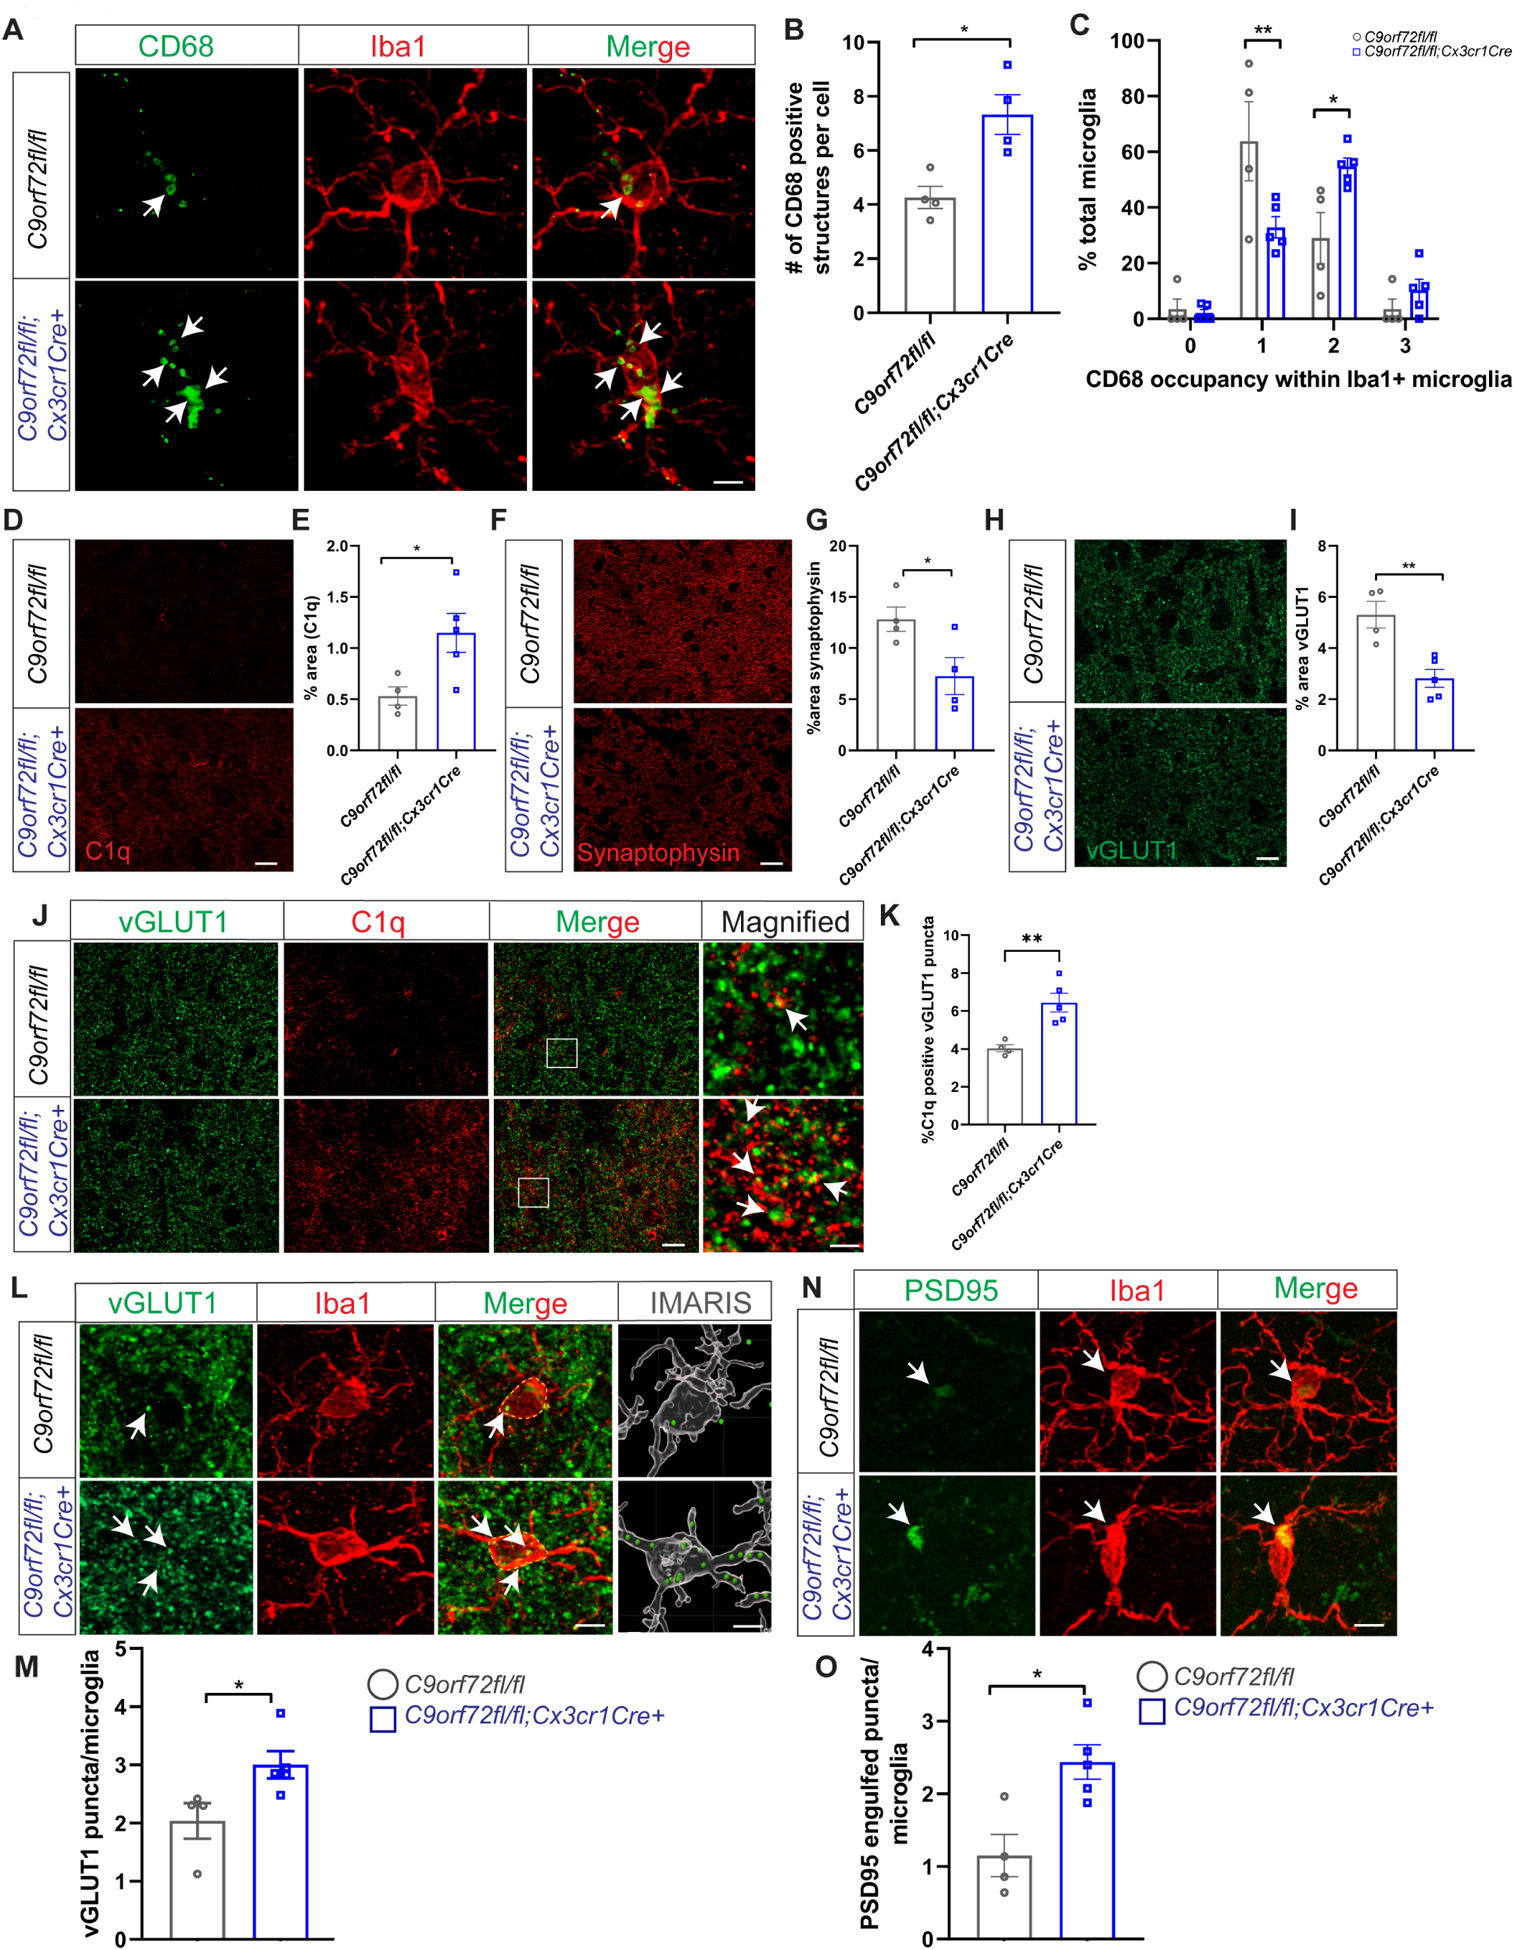
Figure 4: Enhanced synaptic pruning in microglia specific C9orf72 knockout mice.

(A) Iba1 and CD68 co-stain in motor cortex of 12-month C9orf72fl/fl and C9orf72-fl/fl:Cx3cr1Cre+ mice showing CD68+ lysosomal accumulations (white arrows). Scale bars: 5μm. (B) & (C) Quantification of cells with CD68+ lysosomal accumulations. For panel B, mean ±SEM, Unpaired t-test with Welch correction, two-tailed, n=4 per genotype, *p<0.05. For panel C, mean ±SEM, Two-way ANOVA with Sidak’s multiple comparison test, n=4–5 per genotype per age. **p < 0.005, *p < 0.05. (D) Representative images of C1q immunoreactivity in the motor cortex of 12-month-old C9orf72fl/fl and C9orf72fl/fl:Cx3cr1Cre+ mice and (E) quantification, mean ±SEM, Unpaired t test with Welch’s correction, two-tailed, n=4–5 per genotype, *p<0.05. (F) Motor cortex from 12-month-old C9orf72fl/fl and C9orf72-fl/fl:Cx3cr1Cre+ mice immunostained with synaptophysin and (G) quantification, mean ±SEM, Unpaired t-test with Welsh correction, two-tailed, n=4–5 per genotype, *p<0.05. Scale bars: 10μm. (H) Representative confocal images of vGLUT1 immunoreactivity in 12-month-old C9orf72fl/fl and C9orf72-fl/fl:Cx3cr1Cre+ mice and (I) quantification, mean ±SEM, Unpaired t test with Welch’s correction, two-tailed, n=4–5 per genotype, **p<0.005. (J) Representative images of vGLUT1 (green) and C1q (red) proteins in the motor cortex of 12-month C9orf72fl/fl and C9orf72-fl/fl:Cx3cr1Cre+ mice. Scale bars: 10μm Rectangular box indicates magnified region. Scale bars: 5μm. White arrows indicate vGLUT1 positive puncta either co-localized or next to C1q immunoreactive puncta and (K) quantification, mean ±SEM, Unpaired t test with Welch’s correction, two-tailed, n=4–5 per genotype, **p<0.005. (L) Confocal and IMARIS reconstruction images showing vGLUT1+ puncta within Iba+ microglia in motor cortex of 12-month C9orf72fl/fl and C9orf72-fl/fl:Cx3cr1Cre+ (white arrows), scale bars 5μm, 1μm and (M) quantification, mean ±SEM, Unpaired t-test with Welsh correction, two-tailed, n=4–5 per genotype, *p< 0.05. (N) Confocal images showing PSD95+ structures within Iba+ microglia in motor cortex of 12-month C9orf72fl/fl and C9orf72-fl/fl:Cx3cr1Cre+ (white arrows) and (O) quantification, mean ±SEM, Unpaired t-test, two-tailed, n=4–5 per genotype, *p< 0.05. Scale bars: 5μm.
