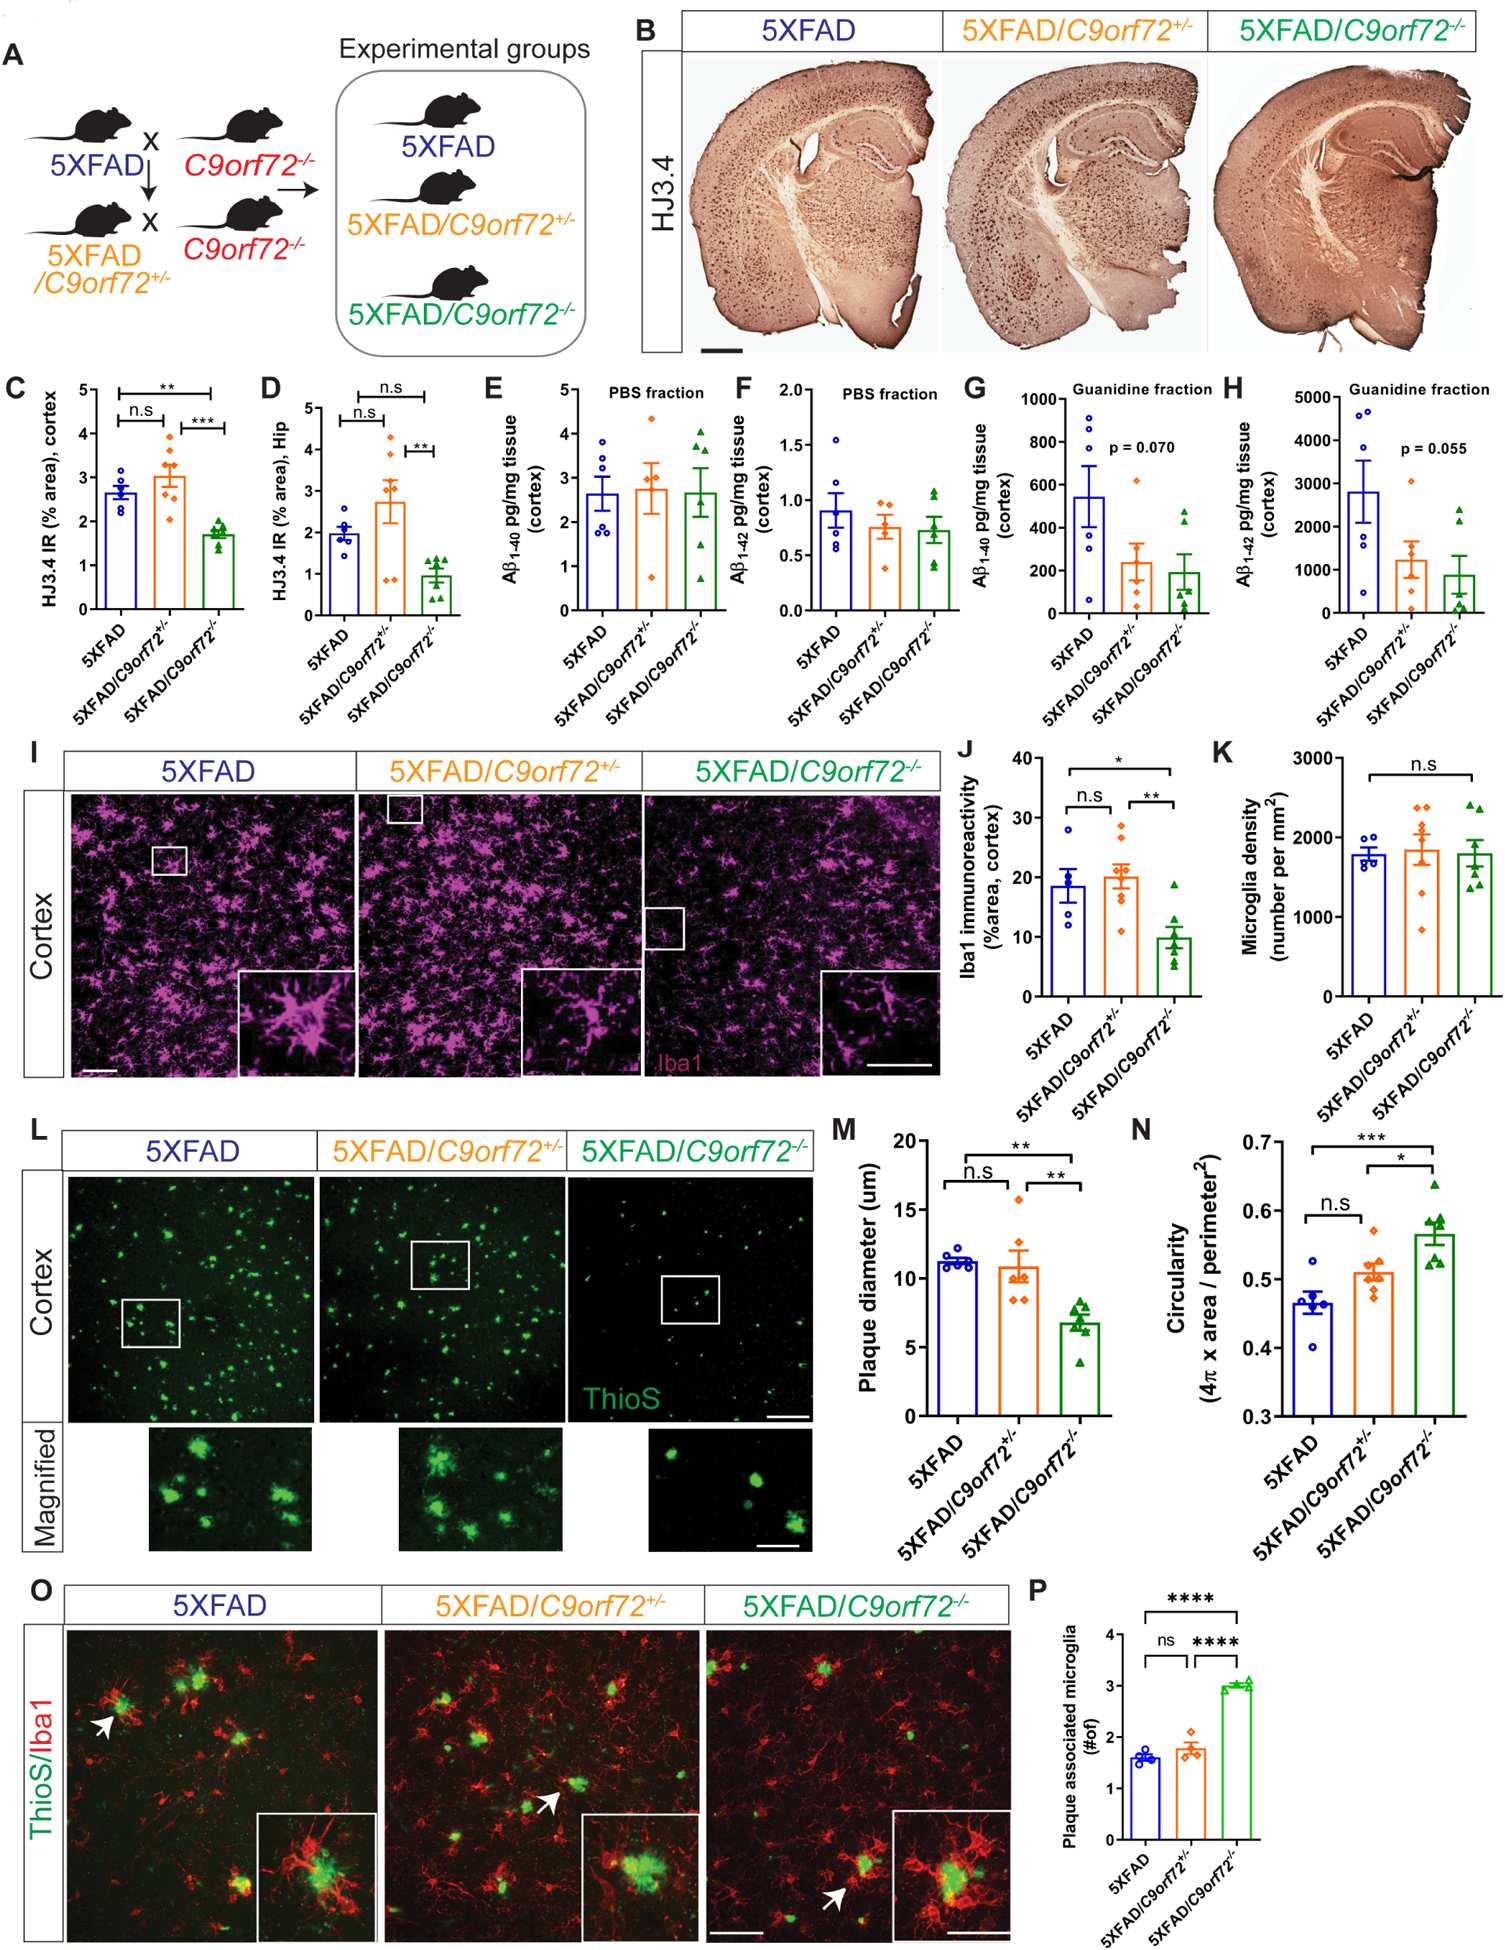
Figure 5: Decreased C9orf72 gene dosage alters amyloid plaque burden and microglial plaque engagement.

(A) Schematic of breeding strategy for experimental groups. (B) Immunostaining for Aβ with mHJ3.4 antibody in 6-month-old 5XFAD, 5XFAD/C9orf72+/−, and 5XFAD/C9orf72−/− animals. Scale bars: 100μm. (C) & (D) Quantification of Aβ immunoreactivity in the cortex and hippocampus respectively, mean ±SEM, One-way ANOVA with Tukey’s multiple comparison test, **p<0.005, ***p<0.0005. (E-H) Soluble and insoluble Aβ1–40 and Aβ1–42 levels in hippocampus of 2-month-old 5XFAD, 5XFAD/C9orf72+/−, and 5XFAD/C9orf72−/− mice as detected by ELISA. (I) Representative confocal maximum intensity projections images of Iba+ microglia in the cortex of 5XFAD, 5XFAD/C9orf72+/−, and 5XFAD/C9orf72−/− animals at 6 months. Scale bars: 100 μm, inset 25μm. (J) Quantification of Iba+ immunoreactivity and (K) microglial density in cortex, n=5–7 per genotype, mean ±SEM, One-way ANOVA with Tukey’s multiple comparison test, *p<0.05, **p<0.005. (L) Representative images of plaque morphology in 6-month-old 5XFAD, 5XFAD/C9orf72+/−, and 5XFAD/C9orf72−/− mice. Scale bars: 100 μm, inset 25μm. (M) Average plaque size and (N) circularity in indicated genotypes, n=6 mice per group, mean ±SEM, One-way ANOVA with Tukey’s multiple comparison test, *p<0.05, **p<0.005, ***p<0.0005. (O) Images showing interaction between microglia (Iba1+, red) and plaques (ThioS, green) in cortex of 6-month-old 5XFAD, 5XFAD/C9orf72+/−, and 5XFAD/C9orf72−/− mice. Scale bars: 50 μm, inset 20μm. (P) Quantification of plaque-associated microglia (Iba1+). n=4 animals per genotype, mean ±SEM, One-way ANOVA with Tukey’s multiple comparison test, ****p<0.0001. See also Figure S4, Figure S5.
