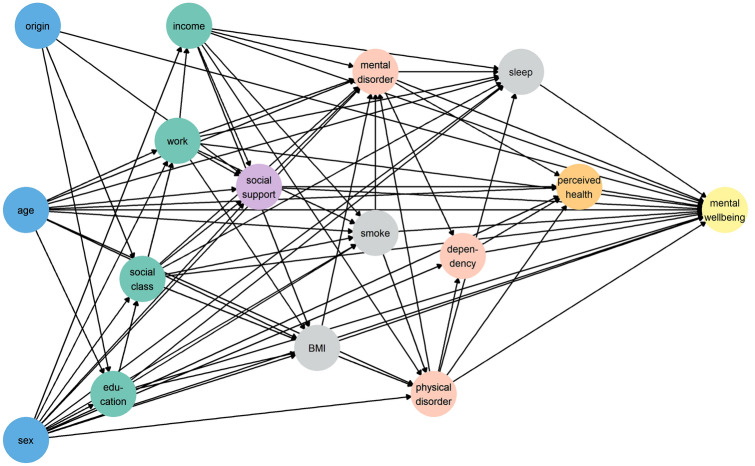
Fig. 1.
Directed acyclic graph (DAG-1). Variable names are abbreviated: origin country of origin; education educational level; work employment status; income family economic difficulties; BMI body mass index; smoke smoking status; sleep hours of sleep; dependency lack of autonomy. Node colours represent the group to which each variable belongs: demographic factors (in blue), socioeconomic factors (in green), relational factors (in purple), lifestyle factors (in grey), health factors (in red), and self-reported health (in orange). (Color figure online)

