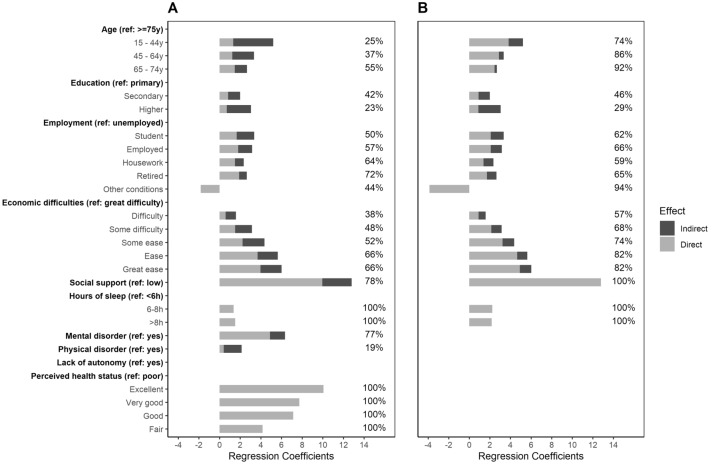
Fig. 2.
Variable total effects, as regression coefficient value, decomposed into direct (light area) and indirect (dark area). Values adjusted by each variable’s minimally sufficient adjustment set (MSAS) a from DAG-1 that includes health factors; and b from DAG-2 that excludes health factors. Values over bars represent the percentage of direct effects over total effects. Only variables significantly associated with mental well-being are represented (P < 0.05). (Color figure online)

