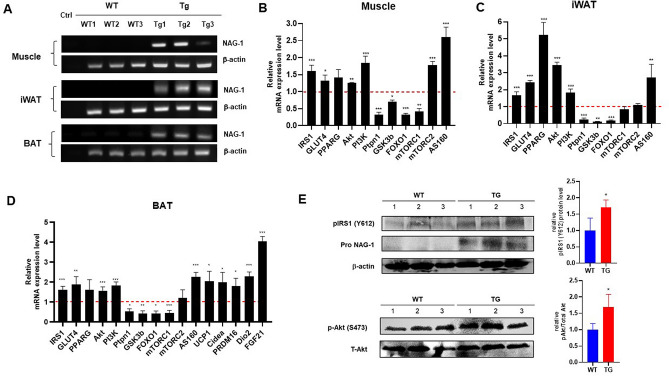
Figure 6.
Effect of NAG-1 on the mRNA expression level of insulin signaling pathway-related factors. (A) RT-PCR of NAG-1 gene expression in the muscle, iWAT, and BAT. Ctrl indicates negative control. The mRNA expression levels of Irs1, Glut4, Pparg, Akt, Pi3k, Ptpn1 (Pten), Gsk3b, Foxo1, Mtorc1, Mtorc2, and As160 in the (B) muscle tissue, (C) inguinal white adipose tissue, and (D) brown adipose tissue were examined using quantitative real-time polymerase chain reaction. The thermogenesis related mRNA level of Ucp1, Cidea, Prdm16, Dio2 and Fgf21 were also determined in BAT. The expression levels of target genes were normalized to those of Gapdh. Data were analyzed using the Student’s t-test and are presented as mean ± standard error of mean. *p < 0.05, **p < 0.01, and ***p < 0.001, compared with the wild-type group (n = 3). (E) Western blot data represent the protein expression of p-Akt (Ser473), total Akt, pIRS1 (Tyr612) and pro-NAG-1 in skeleton muscle of WT diabetic mice (WT) and NAG-1 Tg diabetic mice (TG). The graph represents the relative protein expression. *p < 0.05, compared with the wildtype group. (n = 3 mice per group).

