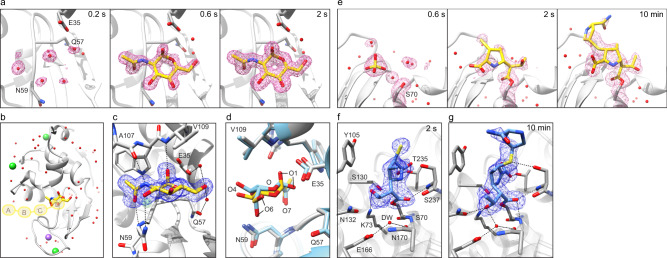
Fig. 2. Drop-on-drop delivery enables the analysis of N-acetyl-D-glucosamine (GlcNAc) binding to the HEWL active site and catalytic activity of CTX-M-15 by serial X-ray crystallography.
a 2mFo–DFc electron density maps for HEWL-GlcNAc XFEL structures, displayed at ±1σ contour level and carved at 2 Å around the GlcNAc ligand. The GlcNAc molecule from the 2 s time point structure was used to carve the 200 ms time point map. All maps are at 1.45 Å resolution. b Cartoon representation of the HEWL structure (2 s mixing time point, PDB ID 7BHN). GlcNAc is shown as sticks and colored in yellow. Waters, sodium, and chloride ions are shown as red, purple, and green spheres, respectively. Ligand binding subsites A-D (as in PDB ID 5NJR10) are indicated by yellow circles. c, d Close-up active site view of the HEWL structure shown in (b). c mFo–DFc polder OMIT difference density map contoured at ±3σ and carved 1.5 Å around the ligand site. Hydrogen bonding network is highlighted. d Superimposition of the 2 s mixing time point structure (yellow and gray) and the single-crystal room-temperature structure of HEWL soaked with GlcNAc obtained by Tanley et al.25 (light blue, PDB 3TXJ). e 2mFo–DFc electron density maps of CTX-M-15 structure displayed at ±1σ and carved at 2 Å around the ertapenem ligand (pink; 1.55, 1.55, and 1.65 Å for 0.6 s, 2, and 10 min, respectively). The 0.6 and 2 s time points are calculated with XFEL data, whereas the 10 min time point is calculated with room temperature, SSX data collected at Diamond Light Source. f, g Close-up view at the active site of the structure obtained after 2 s (f) and 10 min (g) of mixing with ertapenem. Interactions of ertapenem (blue sticks) with residues on the protein main chain (gray sticks) as well as the interactions of the proposed deacylating water (DW, red sphere) with the protein are shown as black dashes. mFo–DFc polder OMIT difference density maps are contoured at ±3σ and carved 1.5 Å around the ligand site. Ertapenem has been tentatively modeled and refined into the observed electron density as the (R)-Δ1-pyrroline tautomer for both 0.6 s and 10 min structures (see Supplementary Note 3). Graphic was created using the UCSF Chimera package54.

