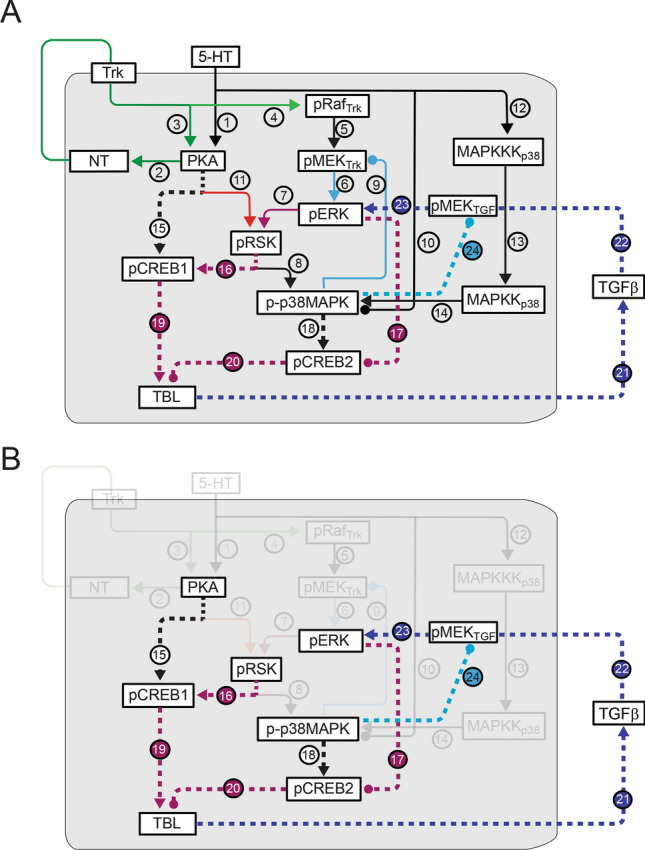
Figure 4.

Schematic network including transcription factors CREB1/2, regulated by PKA and MAPK signaling pathways. (A) Complete pathways in the extended model. The pathways from Fig. 3A are represented as solid, thinner, lines, and the pathway numbers are indicated with unfilled circles. The newly added pathways are dashed, thicker lines, and pathway numbers are indicated with filled circles. The PKA and MAPK cascades interact to regulate the phosphorylation and activities of CREB1 and CREB2, which regulate the expression of TBL. TBL subsequently activates TGF-β. Violet denotes two ERK – > TBL pathways: ERK- > RSK- > CREB1- > TBL, pathway 7- > 16- > 19); ERK- > CREB2- > TBL, pathway 17- > 20). Arrowheads indicate activation, circular ends indicate repression. (B) Network highlighting the addition of new pathways, with the previous pathways made transparent.
