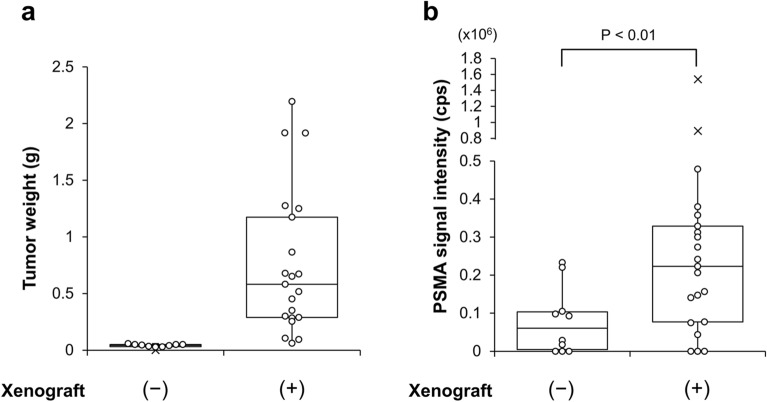
Figure 5.
Measurement of the PSMA-EV levels in serum of mouse xenograft model for PC. The C4-2B PC cells were injected into the subcutaneous space of athymic nude mice. After the formation of tumor, blood was collected and the xenograft tissues were removed from control (n = 10) and xenograft mice (n = 21). (a) The tumor weight was measured. (b) The PSMA-EV levels in serum was determined after purification of EVs from serum by Tim4. Data are shown in the 'box and whiskers' graph with interquartile range (IQR: box), median (thick vertical line in the box) and 1.5 IQR (whiskers). x denotes outliers.

