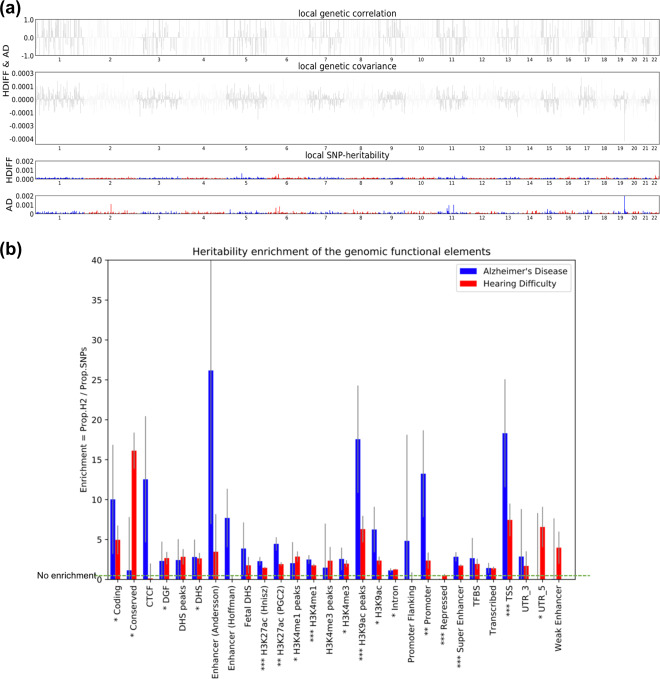
Fig. 1. Genomic region-based analysis plots.
a Manhattan-style plots of local genetic correlation and covariance (top) and local SNP heritability (bottom) for HDiff and AD. Local genetic correlation corresponds to genomic regions that contribute significantly to the genome-wide genetic correlation. Local genetic covariance corresponds to the similarity between HDiff and AD driven by genetic variations localized at a specific region in the genome. b Heritability enrichment (% of heritability/% of SNP) values in HDiff and AD SNPs located in each of 27 genomic functional elements. Error bars represent jackknife standard errors around the estimates of enrichment. Key: CTCF CCCTC-binding factor, DGF digital genomic footprint, DHS DNase I hypersensitive site, TFBS transcription factor binding site, TSS transcription start site, UTR untranslated region. Single, double, and triple asterisks indicate significance at P < 0.05 after Bonferroni-correction in HDiff, AD, and both HDiff and AD, respectively.

