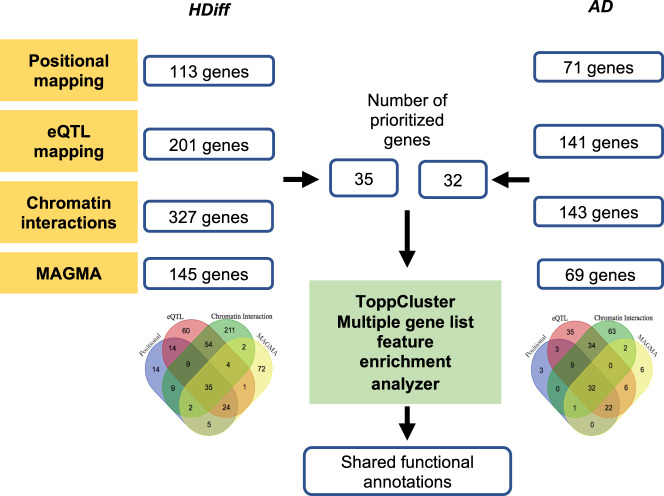
Fig. 4. Flow chart for the gene mapping, prioritization, and gene set enrichment analysis.
Gene lists of FUMA outputs based on position, eQTL, chromatin interactions, and a gene-based associations (MAGMA) analysis were all compared using Venn diagram for HDiff and AD each. The Gene set enrichment analysis of the prioritized genes in HDiff and AD was done using ToppCluster tool producing a list of shared functional enrichment annotations.

