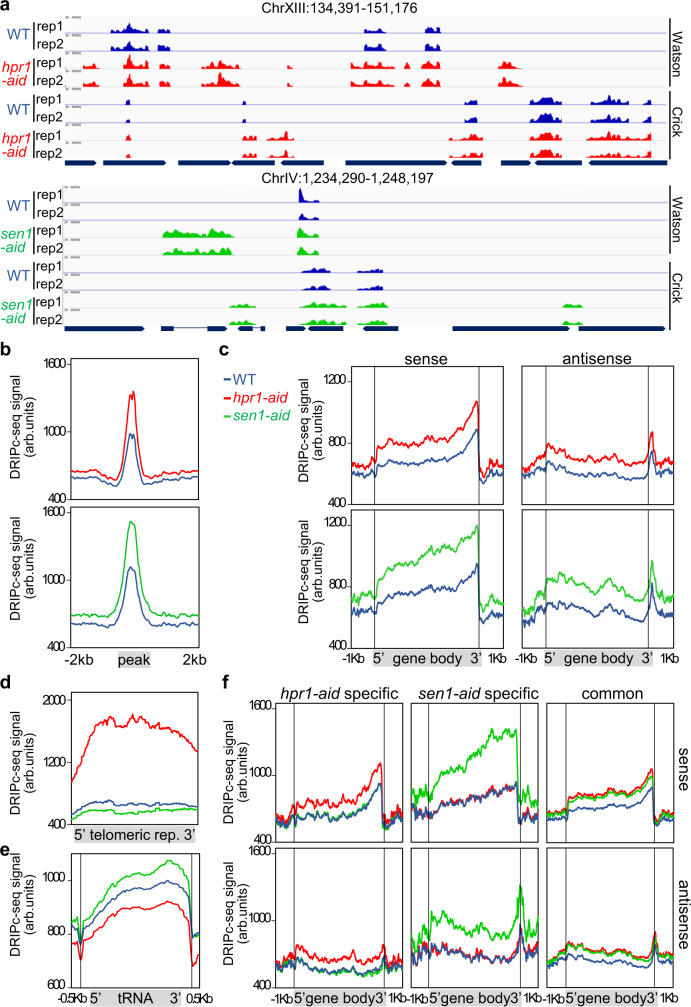
Fig. 5. DNA−RNA hybrids genome-wide accumulation after Hpr1 and Sen1 controlled depletion.
a Representative screenshots of different genomic regions showing the DRIPc-seq signal of detected peaks profiles for WT (blue), hpr1-aid (red), and sen1-aid (green) mapped at Watson and Crick strand (n = 2). b DRIPc-seq signal (average coverage) metaplot analysis of peaks ±2 Kb enriched in samples as in (a). c Distribution of antisense and sense DRIPc-seq signal (average coverage) along a gene metaplot for cells as in (a). d Distribution of DRIPc-seq signal (average coverage) at telomeric repeats metaplot in samples as in (a). e Distribution of DRIPc-seq signal (average coverage) at tRNAs metaplot in samples as in (a). f Distribution of antisense and sense DRIPc-seq signal (average coverage) along specific enriched genes metaplot in samples as in (a).

