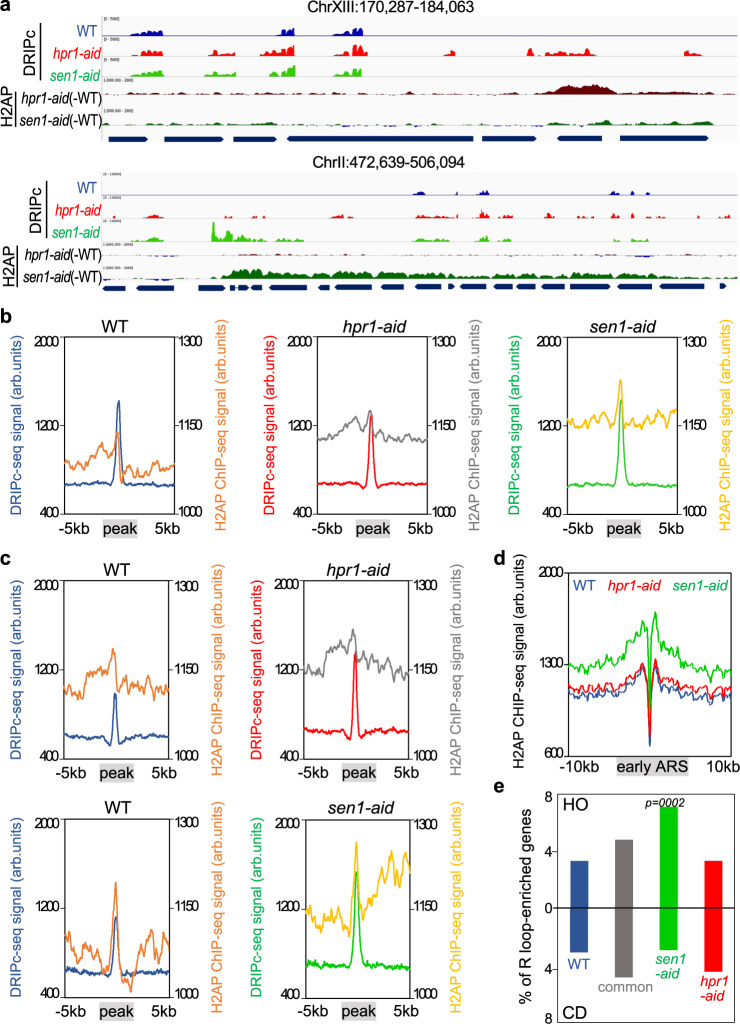
Fig. 6. H2AP genome-wide accumulation after Hpr1 and Sen1 controlled depletion correlate with DNA−RNA hybrids.
a Representative screenshots of different genomic regions in which DRIPc-seq signal of detected peaks (average coverage n = 2) from WT (blue), hpr1-aid (red), and sen1-aid (green) cells. The H2AP ChIP-seq signal from hpr1-aid (dark red) and sen1-aid (dark green) subtracting the WT signal is also shown. b Metaplot analysis of DRIPc-seq peaks ±5 Kb and H2AP ChIP-seq signal detected in WT (orange), hpr1-aid (gray), and sen1-aid (yellow) cells. Other details as in (a). c Metaplot analysis of DRIPc-seq peaks ±5 Kb and H2AP ChIP-seq signal of specific peaks in hpr1-aid cells and sen1-aid cells with respect to the WT. Other details as in (b). d Distribution of H2AP ChIP-seq signal (average coverage) along early ARS ± 10 Kb from WT (blue), hpr1-aid (red), and sen1-aid (green) cells. e Percentage of genes R-loop-enriched in WT (blue), hpr1-aid specific (red), sen1-aid specific (green), and common enriched (gray) that would collide with the replication forks coming from early ARS in head-on (top) or codirectional (bottom) orientation. The P values were calculated by the chi-square test one-sided, one degree of freedom.

