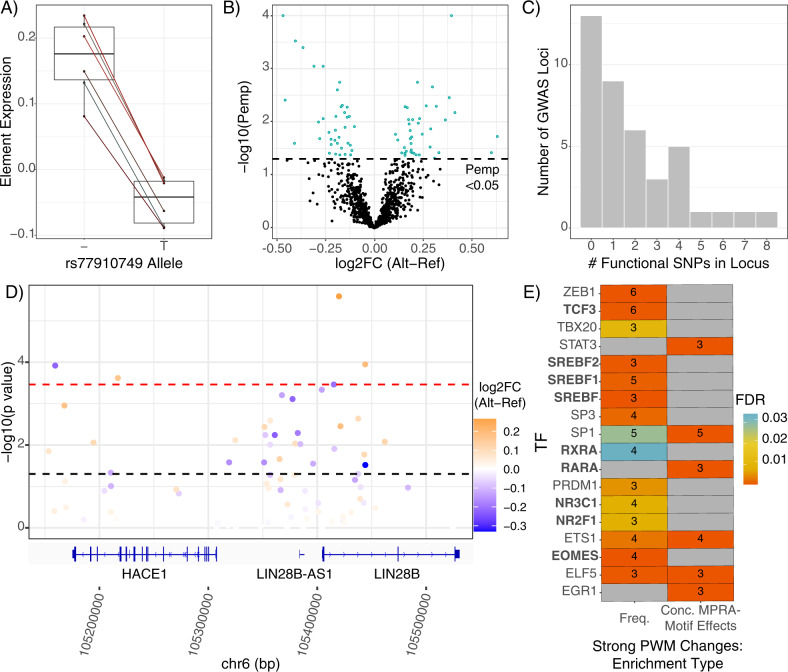
Fig. 2. MPRA defines SNPs with a functional effect on gene expression.
A MPRA results of positive control SNP. Shen et al. found that the T allele drove decreased expression relative to the deletion (“–”) allele, which was robustly reproduced in the present assay. B Volcano plot of allelic differences in reporter expression. Points represent one SNP’s composite log2 allelic fold change (alt vs. ref), determined as the mean of samplewise alternative allele barcode expression minus the matched mean of reference allele barcodes. The dotted line indicates the statistically corrected significance threshold. C Number of functional SNPs (MPRA-significant SNPs) per GWAS locus in the assay. Number of loci (y-axis) containing a given number of MPRA-significant (Pemp < 0.05) SNPs (x-axis). D The LIN28B locus harbors several functional SNPs. SNPs are plotted according to their chromosomal position (hg19) and colored based on their composite log2 allelic fold change. Refseq genes are visualized by the Integrative Genomics Viewer [116]. E TF binding motifs involved in retinoid signaling, steroid synthesis and response, and neural activity are enriched among functional SNPs. Boxes are colored by FDR-corrected significance of enrichment for motifbreakR-defined “strong” allelic perturbations to binding motifs among functional SNPs; the number of functional SNPs perturbing (left column) and/or with concordant motif and MPRA effects (right column) are shown. Concordant effects were defined by greater MPRA expression driven by the allele better-matched to the corresponding TF motif and vice versa—the expected behavior of strictly activating TFs.

