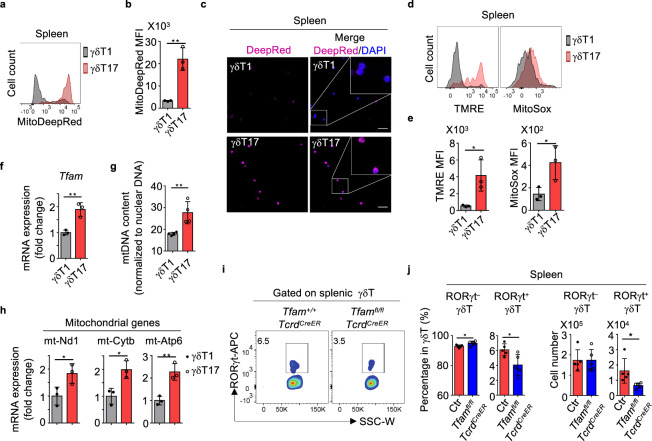
Fig. 1. Tfam deficiency affects γδT1 and γδT17 cells differentially.
a MitoTracker-Deep Red staining in splenic γδT1 and γδT17 cells by flow cytometry. Representative data of three independent experiments. b MitoTracker-Deep Red mean fluorescence intensity (MFI) in a (n = 3 for each group) (**P = 0.0032). Compiled data from one experiment. c Confocal analysis of MitoTracker-Deep Red staining in splenic γδT1 and γδT17 cells. Scale bar, 50 µm. Representative data of two independent experiments. d Tetramethylrhodamine, ethyl ester (TMRE) and MitoSoxTM Red staining in splenic γδT1 and γδT17 cells by flow cytometry. Representative data of three independent experiments. e TMRE (*P = 0.0281) and MitoSoxTM MFI (*P = 0.0404) in d (n = 3 for each group). Compiled data from one experiment. f Expression of Tfam measured by quantitative real-time PCR (qRT-PCR) in the splenic γδT1 and γδT17 cells (n = 3 for each group) (**P = 0.0053). Each dot indicated a biological repeat of individual RNA sample pooled from two mice. Compiled data from two independent experiments. g Mitochondrial DNA content measured by qPCR (mt-Nd1 compared to nuclear gene Hbb) in splenic γδT1 and γδT17 cells (n = 4 for each group) (**P = 0.0091). Compiled data from two independent experiments. h Expression of mitochondrial gene mt-Nd1 (*P = 0.0427), mt-Cytb (*P = 0.0177), and mt-Atp6 (**P = 0.0062) by qRT-PCR in splenic γδT1 and γδT17 cells (n = 3 for each group). Each dot indicated a biological repeat of individual RNA sample pooled from two mice. Compiled data from two independent experiments. i RORγt expression by splenic γδT cells by flow cytometry in mice with indicated genotypes. Representative data of three independent experiments. Mice were treated with tamoxifen daily for 5 days. Data were collected 3 weeks after the last tamoxifen injection. j RORγt– γδT and RORγt+γδT (i.e., γδT17) cell percentages (RORγt– γδT, *P = 0.0299; RORγt+ γδT, *P = 0.0218) within total splenic γδT cells as shown in i and absolute cell numbers (RORγt– γδT, P = 0.9856; RORγt+ γδT: *P = 0.0311) (n = 5 for each group). Compiled data from two independent experiments. Ctr included Tfam+/+TcrdCreER and Tfamfl/+TcrdCreER. Data are shown as mean ± SD in b, e–h, j.

