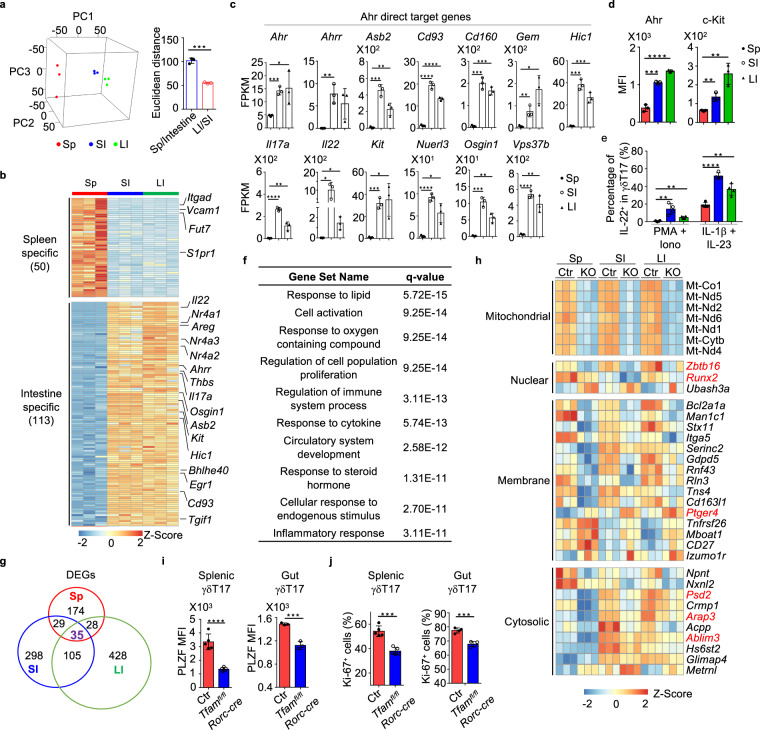
Fig. 4. Gene profiling reveals tissue-specific transcriptomic signature of γδT17 cells.
a Left panel, principal component analysis (PCA) plot of the RNA-seq of Tfam-sufficient splenic (Sp), small intestinal (SI), and large intestinal (LI) γδT17 cells from 3-week-old (n = 3 for each group) mice. γδT17 cells of each sample were sorted from an individual mouse. Right panel, Euclidean distance comparison of the transcriptome of each splenic γδT17 cell sample and the mean intestine centroid vs. the mean small intestine centroid to each large intestinal γδT17 cell sample (n = 3 for each group) (***P = 0.0002). b Heatmap of tissue-specific genes (TSGs) identified by the RNA-seq in Sp, SI, and LI γδT17 cells. Genes were ranked in a descending order based on the fold changes of expression (Sp/[SI and LI average mean]; [SI and LI average mean]/Sp). c RNA-seq FPKM values of Ahr direct target genes of Sp, SI, and LI γδT17 cells (mean ± SD) (n = 3 for each group) (Sp vs. SI: Ahr, ***P = 0.0005, Ahrr, **P = 0.0037, Asb2, ***P = 0.0004, Cd93, ****P < 0.0001, Cd160, ***P = 0.0002, Gem, **P = 0.0096, Hic1, ***P = 0.0002, Il17a, ****P < 0.0001, Il22, *P = 0.0180, Kit, ***P = 0.0004, Nuerl3, ****P < 0.0001, Osgin1, ***P = 0.0002, Vps37b, ****P < 0.0001; Sp vs. LI: Ahr, *P = 0.0460, Ahrr, P = 0.0506, Asb2, **P = 0.0076, Cd93, ****P < 0.0001, Cd160, ***P = 0.0001, Gem, *P = 0.0108, Hic1, ***P = 0.0008, Il17a, **P = 0.0071, Il22, *P = 0.0171, Kit, *P = 0.0166, Nuerl3, *P = 0.0137, Osgin1, **P = 0.0027, Vps37b, **P = 0.0034). FPKM, fragments per kilobase of exon model per million mapped fragments. d Ahr and c-Kit expression in Sp, SI, and LI γδT17 cells by flow cytometry (n = 4 for each group) (Sp vs. SI: Ahr, ***P = 0.0003, c-Kit, **P = 0.0049; Sp vs. LI: Ahr, ****P < 0.0001, c-Kit, **P = 0.0039). Compiled data from one experiment. e Percentages of IL-22+ cells in Sp, SI, and LI γδT17 cells by flow cytometry (n = 4 for each group) (Sp vs. SI: PMA + Iono, **P = 0.0046, IL-1β + IL-23, ****P < 0.0001; Sp vs. LI: PMA + Iono, **P = 0.0021, IL-1β + IL-23, **P = 0.0027). Cells were stimulated with or without PMA (20 ng/ml) plus ionomycin (Iono) (1 μg/ml) but with IL-1β (10 ng/ml) plus IL-23 (10 ng/ml) for 6 h. Compiled data from one experiment. f GO analysis of the 113 TSGs in γδT17 cells. g Pie graph of differentially expressed genes (DEGs) between Ctr and Tfam-deficient γδT17 cells from Sp, SI, and LI. h Heatmap of the 35 core Tfam-regulated DEGs in γδT17 cells. KO indicated Tfamfl/flRorc-cre mice. i Left panel, PLZF expression in splenic γδT17 cells from mice with indicated genotypes by flow cytometry (n = 5 for each group) (splenic, ****P < 0.0001; gut, ***P = 0.0008). Compiled data from two independent experiments. Right panel, PLZF expression in gut γδT17 cells from mice with indicated genotypes by flow cytometry (n = 3 for each group). Compiled data from one experiment. j Left panel, Ki-67 expression in splenic γδT17 cells from 3-week-old mice with indicated genotypes by flow cytometry (n = 5 for each group) (spleen, ***P = 0.0001; gut, ***P = 0.0003). Compiled data from two independent experiments. Right panel, Ki-67 expression in gut γδT17 cells from 1-week-old mice with indicated genotypes by flow cytometry (n = 4 for each group). Compiled data from one experiment. Ctr included Tfamfl/fl, Tfam+/+Rorc-cre, and Tfamfl/+Rorc-cre mice in g–j. Data are shown as mean ± SD in a, c–e, i, j.

