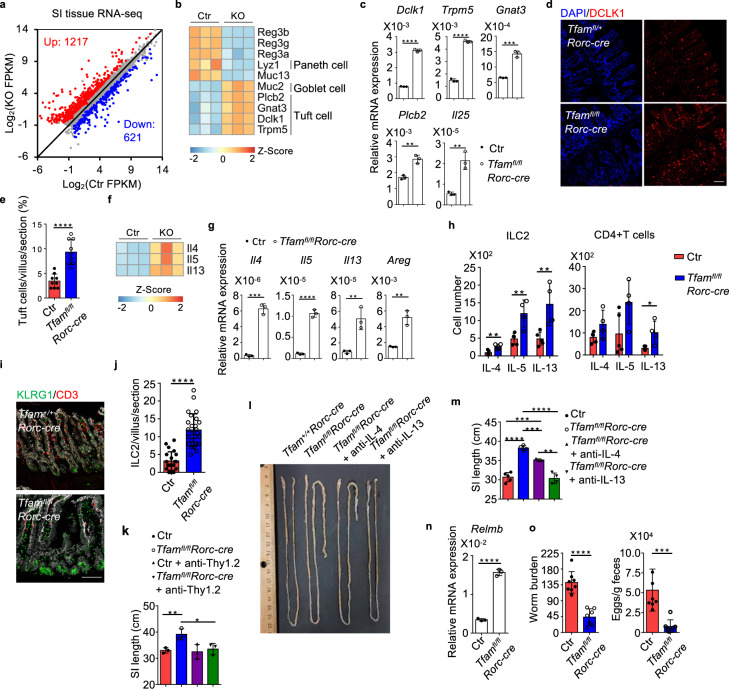
Fig. 5. RORγt-specific ablation of Tfam leads to small intestine tissue remodeling with enhanced tuft cell–ILC2 circuit.
Ctr included Tfam+/+Rorc-cre and Tfamfl/+Rorc-cre mice in a, b, f. KO indicated Tfamfl/flRorc-cre mice. a Differential gene expression by RNA-seq analysis of small intestine tissues of Ctr (n = 3) and KO mice (n = 3) at 12-week-old age (fold change ≥1.5, q value ≤0.05). b Heatmap of indicated gene expression from RNA-seq analysis of small intestine tissues of Ctr and KO mice. Each sample represented one individual mouse. c Analysis of tuft cell-related gene expression by qRT-PCR in the small intestine tissues of 12-week-old Ctr and Tfamfl/flRorc-cre mice (n = 3) (Dclk1, ****P < 0.0001; Trpm5, ****P < 0.0001; Gnat3, ***P = 0.0002; Plcb2, **P = 0.0023; Il25, **P = 0.0030). Representative data of three independent experiments. Ctr included Tfam+/+, Tfamfl/+, Tfamfl/fl, Tfam+/+Rorc-cre, and Tfamfl/+Rorc-cre mice in c, e, g–o. d Confocal analysis of tuft cells by DCLK1 staining in the small intestine (ileum) of 12-week-old mice with indicated genotypes. Red, DCLK1 staining. Blue, DAPI nuclear staining. Scale bar, 200 µm. Representative data from three independent experiments. e Quantification of tuft cells (DCLK1+) in each small intestine villus viewed by confocal microscopy (n = 9 villi for each group) (****P < 0.0001). Compiled data from two independent experiments. f Heatmap of indicated gene expression from RNA-seq analysis of small intestine tissues of Ctr and KO mice. g Analysis of Il4, Il5, Il13, and Areg expression by qRT-PCR in small intestine tissues of 12-week-old Ctr and Tfamfl/flRorc-cre mice (n = 3) (Il4, ***P = 0.0001; Il5, ****P < 0.0001; Il13, **P = 0.0066; Areg, **P = 0.0023). Representative data of three independent experiments. h IL-4, IL-5, and IL-13 expression in ILC2s or CD4+ T cells by flow cytometry from the small intestine draining lymph nodes (siLN) of Ctr (n = 5) and Tfamfl/flRorc-cre (n = 4) mice at 12-week-old age (ILC2: IL-4, **P = 0.0082; IL-5, **P = 0.0064; IL-13, **P = 0.0097; CD4+ T cells: IL-4, P = 0.0929; IL-5, P = 0.0652; IL-13, *P = 0.0194). Compiled data from two independent experiments. i Confocal analysis of ILC2s (CD3–KLRG1+) in the small intestine (ileum) of 12-week-old mice with indicated genotypes. Red, CD3 staining. Green, KLRG1 staining. White, EpCAM staining. Scale bar, 200 µm. Representative data of three independent experiments. j Quantification of ILC2s (CD3–KLRG1+) in each small intestine villus viewed by confocal microscopy (****P < 0.0001). Ctr, n = 21, Tfamfl/flRorc-cre, n = 22. Compiled data from two independent experiments. k Small intestine length in Ctr or Tfamfl/flRorc-cre mice treated with anti-Thy1.2 neutralizing antibody for 3 weeks (n = 3 for each group) (Ctr vs. Tfamfl/flRorc-cre, **P = 0.0098; Tfamfl/flRorc-cre vs. Tfamfl/flRorc-cre + anti-Thy1.2, *P = 0.0312). Compiled data from two independent experiments. l Picture of small intestines in mice of indicated genotypes treated with anti-IL-4 antibody (100 µg/mouse) or anti-IL-13 antibody (50 µg/mouse) twice a week from 6-week-old age for 3 weeks by intraperitoneal cavity injection. Representative data of two independent experiments. m Small intestine length. Compiled data from two independent experiments (Ctr vs. Tfamfl/flRorc-cre, ****P < 0.0001; Ctr vs. Tfamfl/flRorc-cre + anti-IL-4, ***P = 0.0009; Tfamfl/flRorc-cre vs. Tfamfl/flRorc-cre + anti-IL-4, ***P = 0.0006; Tfamfl/flRorc-cre vs. Tfamfl/flRorc-cre + anti-IL-13, ****P < 0.0001; Tfamfl/flRorc-cre + anti-IL-4 vs. Tfamfl/flRorc-cre + anti-IL-13, **P = 0.0022). n = 5 for Ctr, n = 4 for Tfamfl/flRorc-cre mice; n = 3 for Tfamfl/flRorc-cre mice treated with anti-IL-4; n = 4 for Tfamfl/flRorc-cre mice treated with anti-IL-13. n Analysis of Relmb expression by qRT-PCR in the small intestine tissues of 12-week-old Ctr and Tfamfl/flRorc-cre mice (n = 3) mice at 14 days after Hpb infection (****P < 0.0001). Representative data of three independent experiments. o Left panel, Hpb worm burden in small intestine lumen of Ctr (n = 8) and Tfamfl/flRorc-cre mice (n = 7) at 14 days after Hpb infection (****P < 0.0001). Right panel, Hpb egg counts per gram feces in Ctr (n = 8) and Tfamfl/flRorc-cre mice (n = 7) mice at 14 days after Hpb infection (***P = 0.0008). Compiled data from three independent experiments. Data are shown as mean ± SD in c, e, g, h, j, k, m–o. *, **, ***, **** indicated P values ≤0.05, 0.01, 0.001, 0.0001, respectively.

