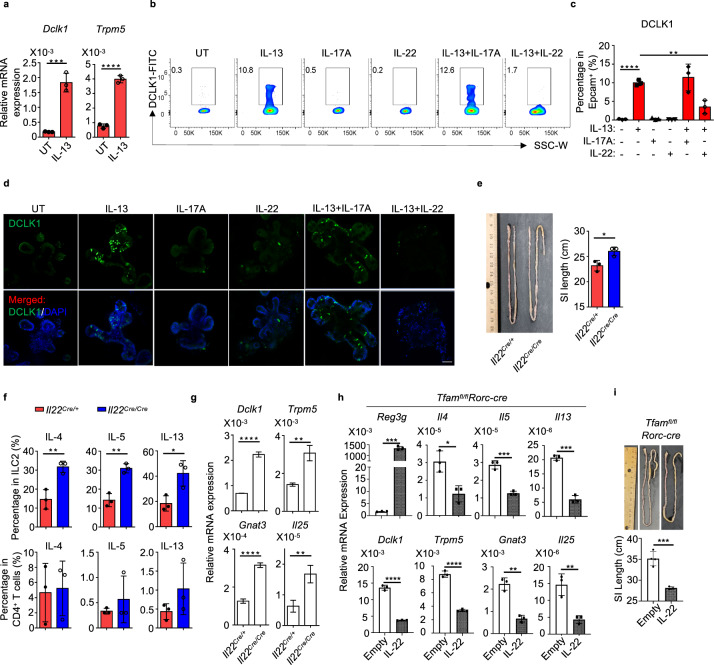
Fig. 6. IL-22 suppresses IL-13-induced tuft cell differentiation.
a Analysis of Dclk1 and Trpm5 expression by qRT-PCR in enteroid culture (n = 3) (mean ± SD) (Dclk1, ***P = 0.0008; Trpm5, ****P < 0.0001). Representative data of three independent experiments. b DCLK1 expression in enteroid culture with indicated treatment (IL-13 (50 ng/ml), IL-17A (100 ng/ml), and/or IL-22 (5 ng/ml)) measured by flow cytometry. Representative data of two independent experiments. c Percentages of DCLK1+ cells in EpCAM+ cells (mean ± SD) (n = 3) (none vs. IL-13, ****P < 0.0001; IL-13 vs. IL-13 + IL-22, **P = 0.0045). Compiled data from one experiment. d Confocal analysis of DCLK1 expression in enteroid culture with indicated treatment. Representative data of two independent experiments. Green, DCLK1. Blue, DAPI. Scale bar: 50 µm. e Left panel, picture of the small intestine of 8-week-old littermate Il22Cre/+ and Il22Cre/Cre mice (*P = 0.0223). Representative data of two independent experiments. Right panel, small intestine length in mice with indicated genotypes (n = 3). Compiled data from two independent experiments. f IL-4, IL-5, and IL-13 expression in ILC2s or CD4+ T cells by flow cytometry from the small intestine of 8-week-old Il22Cre/+ and Il22Cre/Cre mice (n = 3) (ILC2: IL-4, **P = 0.0076; IL-5, **P = 0.0024; IL-13, *P = 0.0245; CD4+ T: IL-4, P = 0.8613; IL-5, P = 0.4343; IL-13, P = 0.2181). Compiled data from two independent experiments. g Analysis of Dclk1, Trpm5, Gnat3, and Il25 expression by qRT-PCR in small intestine tissues of 8-week-old Il22Cre/+ and Il22Cre/Cre mice (n = 3) (Dclk1, ****P < 0.0001; Trpm5, **P = 0.0023; Gnat3, ****P < 0.0001; Il25, **P = 0.0062). Representative data of two independent experiments. h, i Tfamfl/flRorc-cre mice at the age of 6 weeks old received hydrodynamic tail vein injection of either empty or IL-22 vectors. Mice were sacrificed at 10 weeks of age and small intestine tissues were harvested. h qRT-PCR gene expression analysis of small intestine tissue IL-22-target gene Reg3g, type 2 cytokine genes Il4, Il5, and Il13, and tuft cell-associated genes Dclk1, Trpm5, Gnat3, and Il25 (n = 3) (Reg3g, ***P = 0.0001; Il4, *P = 0.0139; Il5, ***P = 0.0004; Il13, ***P = 0.0001; Dclk1, ****P < 0.0001; Trpm5, ****P < 0.0001; Gnat3, **P = 0.0011; Il25, **P = 0.0063). Representative data of three independent experiments. i Top panel, picture of the small intestine length. Bottom panel, quantification of the small intestine length (n = 4 for empty group and n = 3 for IL-22 treatment group) (***P = 0.0009). Compiled data from one experiment. Data are shown as mean ± SD in a, c, e–i.

