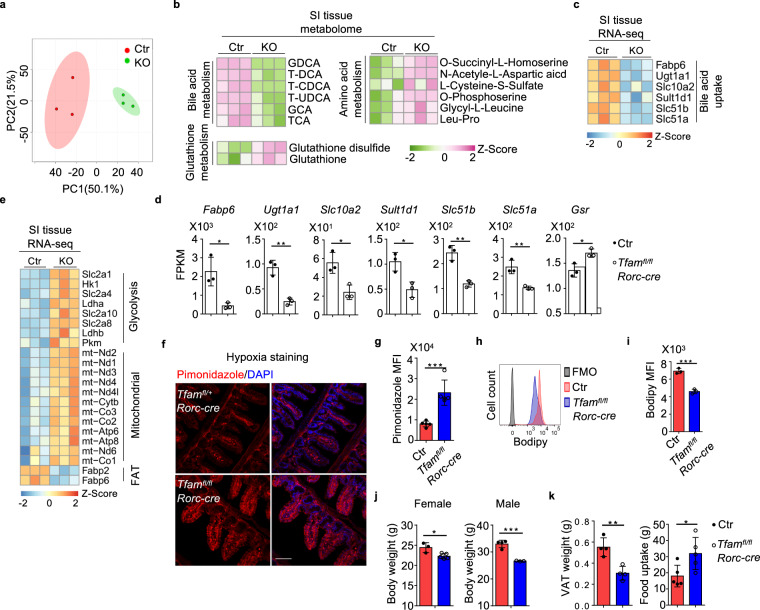
Fig. 7. Tfam deletion in RORγt+ lymphocytes lead to global metabolomic changes in the small intestine.
Ctr included Tfam+/+Rorc-cre and Tfamfl/+Rorc-cre mice, while KO indicated Tfamfl/flRorc-cre mice in a–e. a PCA analysis of the metabolome of small intestine tissues of 12-week-old Ctr and KO mice (n = 3 for each group). Each group included three individual mice. b Heatmap of the differentially regulated metabolites between small intestine tissues of Ctr and KO groups identified by the metabolome analysis. Metabolites were ranked in a descending order based on the fold changes of abundance (Ctr/KO; KO/Ctr). c Heatmap of indicated gene expression of small intestine tissue RNA-seq of Ctr and KO mice as shown in Fig. 5a. Genes were ranked in a descending order based on the fold changes of expression (Ctr/KO). d RNA-seq FPKM values of indicated genes in small intestine tissues of the mice (n = 3) (Fabp6, *P = 0.0155; Ugt1a1, **P = 0.0019; Slc10a2, *P = 0.0162; Sult1d1, *P = 0.0158; Slc51b, **P = 0.0027; Slc51a, **P = 0.0066; Gsr, *P = 0.0186). e Heatmap of DEGs in small intestine tissues of the mice identified by RNA-seq (n = 3). Genes were ranked in a descending order based on the fold changes of expression (KO/Ctr). Ctr included Tfam+/+, Tfamfl/+, Tfamfl/fl, Tfam+/+Rorc-cre, and Tfamfl/+Rorc-cre mice in g–k. f Confocal analysis of hypoxia by pimonidazole staining in the small intestine (ileum) of 12-week-old mice with indicated genotypes. Red, pimonidazole staining. Blue, DAPI staining. Scale bar, 200 µm. Representative data of three independent experiments. g Pimonidazole MFI in the epithelial cells shown in f (n = 5 for each group) (***P = 0.0006). Compiled data from one experiment. h Bodipy uptake in small intestine epithelial cells from Ctr and Tfamfl/flRorc-cre mice measured by flow cytometry. Representative data of two independent experiments. i Bodipy MFI in the epithelial cells as shown in h (n = 3 for each group) (***P = 0.0006). Compiled data from one experiment. j Body weight of 5-month-old female Ctr (n = 3) and Tfamfl/flRorc-cre mice (n = 5) and male Ctr (n = 4) and Tfamfl/flRorc-cre mice (n = 3) (female, *P = 0.0169; male, ***P = 0.0006). Compiled data from two independent experiments. k Visceral adipose tissue (VAT) weight (n = 4) and 4-day-food uptake (n = 5) in 5-month-old mice with indicated genotypes (VAT, **P = 0.0039; food uptake, *P = 0.0321). Compiled data from two independent experiments. Data are shown as mean ± SD in d, g, i–k.

