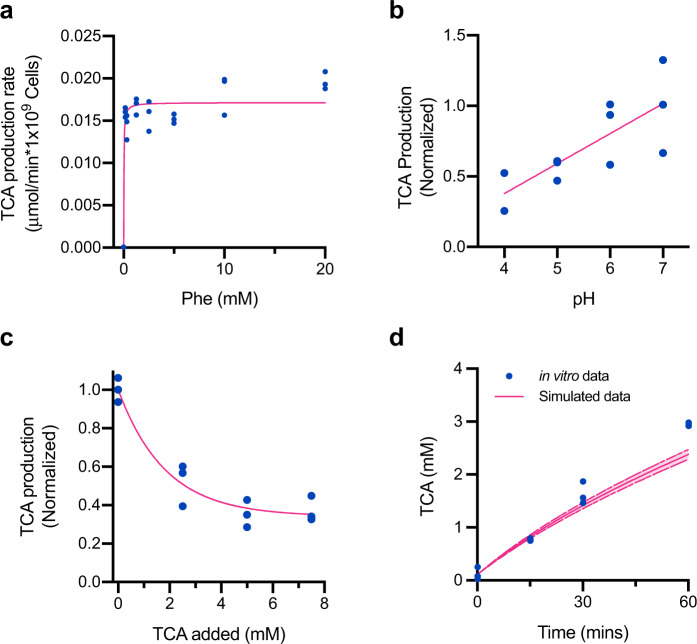
Fig. 1. Model of SYNB1618 PAL activity in vitro.
a TCA production rate by SYNB1618 in PBS containing various initial concentrations of Phe. Points represent experimental replicates (blue; n = 3 replicate cultures per initial Phe concentration), with rates normalized to SYNB1618 cell density and time. The Michaelis–Menten curve fit to the experimental data is shown in pink (R2 = 0.7805). b Effect of pH on TCA production by SYNB1618 at 20 mM Phe. Points represent experimental replicates (blue; n = 3 replicate cultures per treatment) and indicate the fraction of TCA produced at pH 7.0. Linear regression to the data is shown in pink (R2 = 0.6002). c Effect of exogenous TCA on de novo d5-TCA production by SYNB1618 incubated with 20 mM d5-Phe. Points represent experimental replicates (blue; n = 3 replicate cultures per treatment) and indicate the fraction of d5-TCA produced de novo in the absence of exogenously added unlabeled TCA. An exponential decay curve fit to the data is shown in pink (R2 = 0.9361). Comparison of TCA production by SYNB1618 in an in vitro gastric simulation (IVS) assay (blue) and simulated TCA production using the SYNB1618 in vitro PAL activity model (solid pink line). Points represent experimental replicates (n = 3 replicate measurements per time point), and upper and lower bounds for simulated data (dashed pink lines) represent simulations performed using 95% confidence intervals for the PAL activity parameters, KmPAL and VmaxPAL, as described in the main text.

