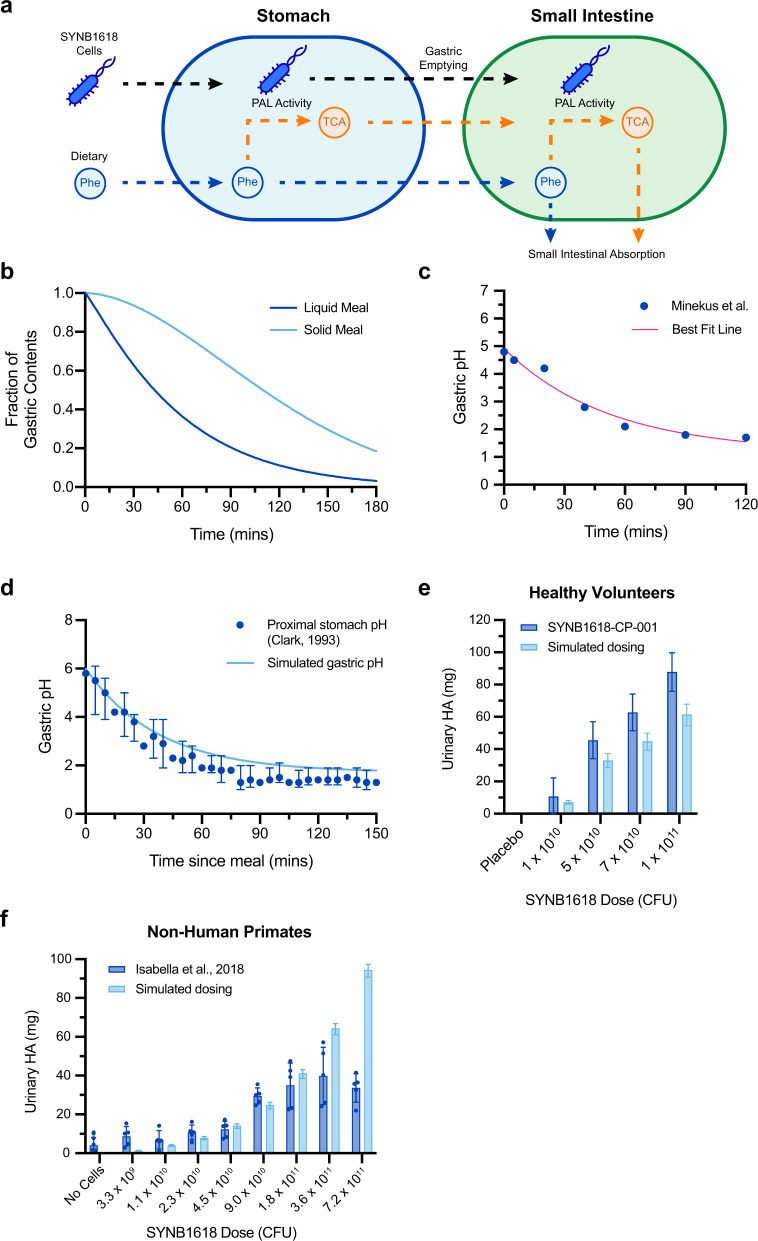
Fig. 2. Mechanistic model of SYNB1618 PAL activity in the human upper GI.
a Schematic representation of the human upper gastrointestinal SYNB1618 PAL activity model. The model is comprised of two compartments, with the stomach compartment emptying into the small intestine compartment. Conversion of Phe to TCA by SYNB1618 PAL in the stomach and small intestine are simulated using Michaelis-Menten kinetics. Absorption of Phe and TCA is also modeled in the small intestine. b Example of simulated gastric emptying curves using representative parameters for a liquid meal (β = 1.12, t1/2 = 43 min) or a solid meal (β = 1.81, t1/2 = 110 min). All simulations described in the main text assume liquid meals. c Postprandial gastric pH values recommended by Minekus et al.36 for in vitro simulation studies (blue) and best fit exponential decay curve employed for human upper gastrointestinal model (pink; R2 = 0.9677). d Simulated postprandial gastric pH (light blue) compared to proximal gastric pH of healthy subjects from Clark et al.20, following an oatmeal breakfast (median with interquartile ranges for n = 20 healthy volunteers; blue). e Urinary HA recovery (normalized to placebo and baseline values) from an SYNB1618 dose-escalation study in healthy subjects (blue; n = 8 subjects per dose level; mean ±SEM)16, compared to simulated SYNB1618 HA production using the human upper gastrointestinal activity model (light blue). f. Urinary HA recovery from NHP after administration of oral doses of SYNB1618 (blue; n = 5 animals per SYNB1618 dose level, n = 10 animals for no cells control; mean ±SEM)14, compared to simulated SYNB1618 HA production using parameters representing the NHP upper gastrointestinal tract (light blue). For e–f simulated data error bars represent 95% confidence intervals of the SYNB1618 PAL kinetic parameters, KmPAL and VmaxPAL, as described in the main text.

