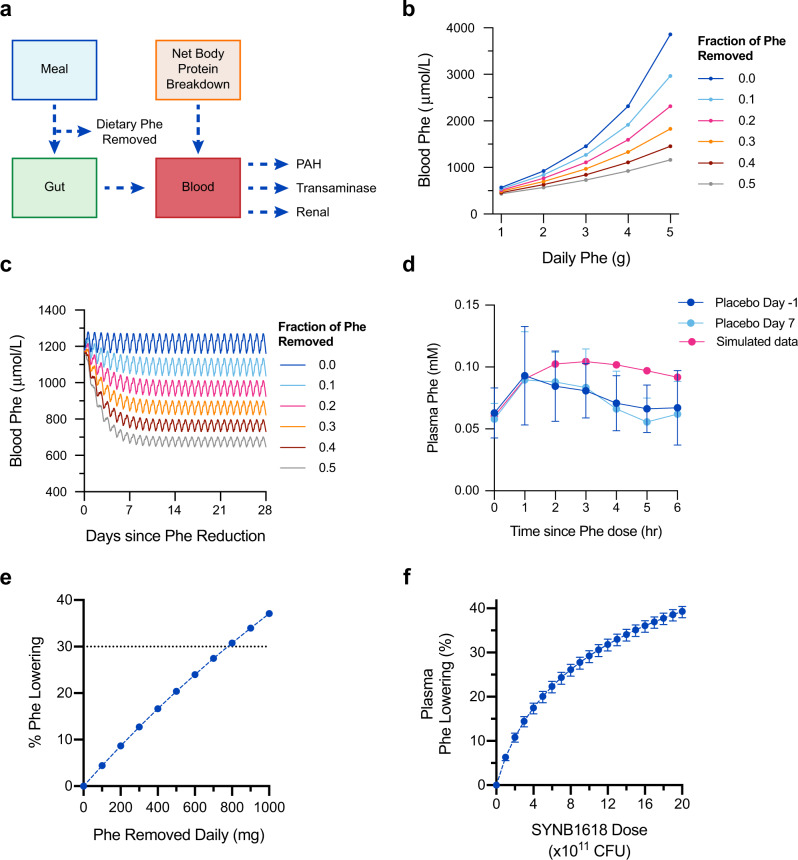
Fig. 3. Model of blood Phe metabolism and blood Phe lowering with Phe removal from diet.
a Schematic representation of blood Phe metabolism model, including contributions of Phe from meals and body protein breakdown, and elimination of Phe by PAH and transaminase activity, as well as renal excretion. Dietary Phe can be removed through SYNB1618 PAL activity. b Simulated fasting blood Phe concentrations for a classical PKU patient (0% PAH activity) across a range of dietary Phe intake and the effect of removal of 10–50% of dietary Phe on blood Phe concentrations. 180-day simulations were performed, and blood Phe concentrations 14 h following a meal are displayed. c Simulated blood Phe concentrations for a classical PKU patient (0% PAH activity) consuming 2.5 g Phe per day over 28 days, with the removal of 10–50% dietary Phe. d Simulated blood Phe concentrations in healthy subjects (100% PAH activity) receiving 1.0 g dietary Phe, compared with healthy subjects enrolled in the placebo arm of the first-in-human SYNB1618 clinical trial on study days ‒1 and 7 (n = 8 subjects per dose level; mean ±SD). e Estimated blood Phe lowering (%) for a classical PKU patient (0% PAH activity) following a nonadherent diet (2.5 g Phe daily), assuming 28 days of SYNB1618 dosing that consumes up to 1000 mg Phe daily. f Estimated blood Phe lowering (%) for a classical PKU patient (0% PAH activity) following a nonadherent diet (2.5 g Phe daily), assuming 28 days of SYNB1618 administration three-times daily with meals, using doses ranging from 0 to 2 × 10¹² CFU, considering PAL activity only. Upper and lower bounds of simulated data represent 95% confidence intervals of the SYNB1618 PAL kinetic parameters, KmPAL and VmaxPAL, as described in the main text.

