Figure 2.
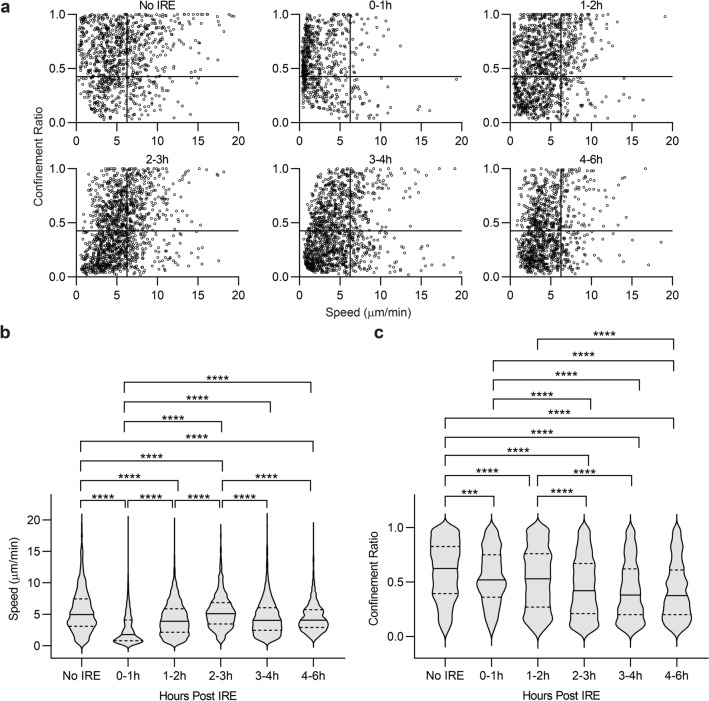
Neutrophil speed and confinement ratio change dynamically after IRE. (a) Speed and confinement ratio (displacement/track length) of neutrophils were determined by intravital imaging in liver parenchyma at baseline (No IRE) and for each hour after 1500 V/cm IRE treatment up to the 4-6 h time bracket. Each point on the scatter graphs represents a single cell, with its speed plotted against its confinement ratio. Each graph shows the movement characteristics of 680–1290 individual neutrophils, pooled from 4–6 independent experiments using separate animals. (b) Speed and (c) Confinement ratio of tracked neutrophils are represented in violin plots, in which solid lines show medians and dotted lines show quartiles. For both parameters, one-way ANOVA indicates significant differences between No IRE and all time brackets after IRE (p < 0.0001). Post hoc Tukey multiple comparison demonstrates ***p < 0.001 and ****p < 0.0001.

