Figure 3.
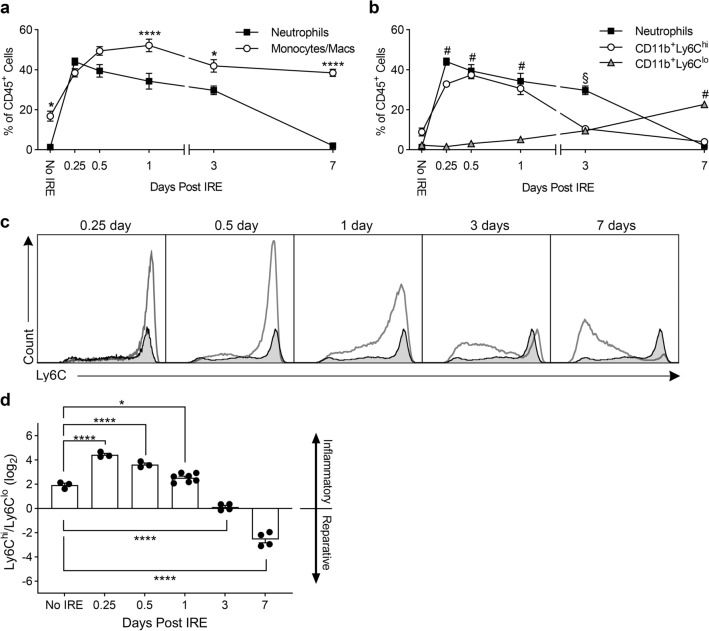
Neutrophils and CD11b+Ly6Chi monocytes/macrophages predominate early after IRE, whereas CD11b+Ly6Clo monocytes/macrophages predominate later. (a) Myeloid cells were isolated from control (No IRE) or IRE-treated liver, and multi-color flow cytometry determined the numbers of neutrophils and monocytes/macrophages through time. (b) CD11b+ monocytes/macrophages were subdivided into Ly6Chi and LyClo populations to show the relationship with neutrophils. For (a,b), cell type and time were assigned as independent variables, and 2-way ANOVA showed significant interaction between the two factors (p < 0.0001). In (a), Holm–Sidak multiple comparison showed significant differences between neutrophils and monocytes/macrophages in livers that received No IRE and in livers 1, 3, and 7 days after IRE (*p < 0.05, ****p < 0.0001). In (b), Tukey multiple comparison showed significant differences #between neutrophils and CD11b+Ly6Chi compared to CD11b+Ly6Clo on days 0.25, 0.5, 1, and 7, and §between neutrophils compared to CD11b+Ly6Chi and CD11b+Ly6Clo on day 3 (p < 0.0001). Data represent mean ± SEM with 3–7 independent biological replicates (n = 3–7). (c) Representative flow cytometry histograms of Ly6C expression on CD11b+ monocytes/macrophages after IRE treatment. Shaded histograms represent Ly6C expression on CD11b+ monocytes/macrophages in control liver that did not undergo IRE. (d) Ly6Chi to Ly6Clo monocyte/macrophage ratio in control liver (No IRE) and in liver treated with IRE through time. One-way ANOVA indicate significant differences between No IRE and timepoints after IRE treatment (p < 0.0001). Holm–Sidak multiple comparison comparing No IRE to each of the post-IRE timepoints shows *p < 0.05 and ****p < 0.0001 as indicated. Individual points represent independent biological replicates (n = 3–7). Graph bars and error bars show mean ± SEM.

