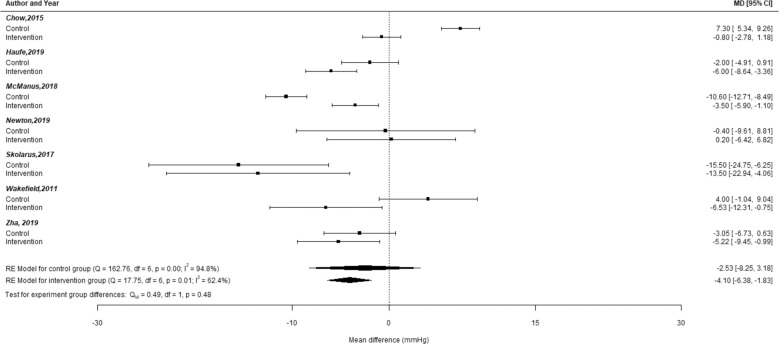
Fig. 2. Plot of mean differences in SBP change between the intervention group and control group at 6-months for RCTs included in meta-analyses.
Forest plot of the mean difference in systolic blood pressure (SBP) within the experimental group. The top portion of this figure shows the mean difference (MD) in SBP at 6 mo within the intervention or control group for each study. Error bars for each study signify the 95% confidence intervals for the mean difference within the control group or intervention group for each study. The control groups for all studies were combined to create an estimated average effect in a random-effects model. A similar procedure was done for the intervention groups. The summary polygons at the bottom of the plot show results of random-effects models. Among all participants in the intervention group, there was a statistically significant decrease in the mean difference for SBP change. However, this mean difference estimate was not significantly different from the estimate from the control group (test for experimental group difference: p = 0.48).

