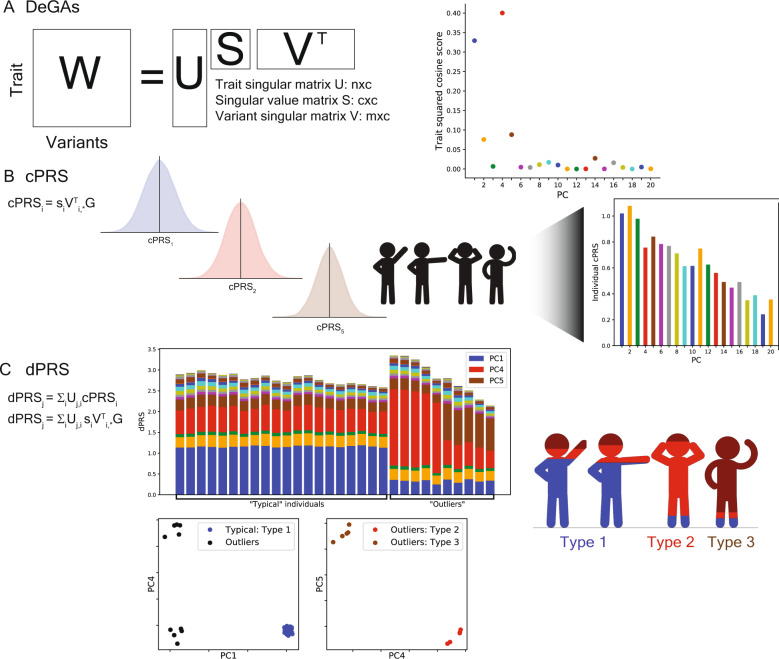
Fig. 1. Study overview.
A Matrix Decomposition of Genetic Associations (DeGAs) is performed by taking the truncated singular value decomposition (TSVD) of a matrix W (n × m) containing summary statistics from GWAS of n = 977 traits over m = 469,341 variants from the UK Biobank. The squared columns of the resulting singular matrices U (n × c) and V (m × c) measure the importance of traits (variants) to each component; the rows map traits (variants) back to components. The squared cosine score (a unit-normalized row of US) for some hypothetical trait indicates high contribution from PC1, PC4, and PC5. B Component polygenic risk scores (cPRS) for the ith component are defined as SIVTI, *G (ith singular value in S and ith row in VT), for an individual with genotypes G. C DeGAs polygenic risk scores (dPRS) for trait j are recovered by taking a weighted sum of cPRSI, with weights from U (j, ith entry). We also compute DeGAs risk profiles for each individual (see “Methods”), which measure the relative contribution of each component to genetic risk. We “paint” the dPRS high-risk individuals with these profiles and label them “typical” or “outliers” based on similarity to the mean risk profile (driven by PC1, in blue). Outliers are clustered on their profiles to find additional genetic subtypes: this identifies “Type 2” and “Type 3,” with risk driven by PC4 (red) and PC5 (tan). Clusters visually separate each subtype along relevant cPRS (below). Image credit: VectorStock.com/1143365 (color figure online).

