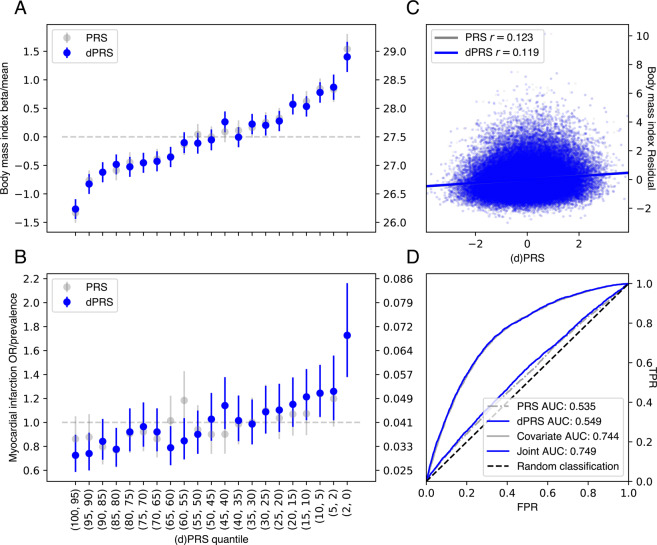
Fig. 2. Performance of dPRS.
A, B Effect of increased risk (dPRS or PRS) on BMI and MI. Beta/OR (left axis) were estimated by comparing the quantile of interest (x-axis) with a middle quantile (40–60%), adjusted for these covariates: age, sex, 4 PCs (see “Methods”). Trait mean or prevalence (right axis) was computed within each quantile; error bars denote the 95% confidence interval of each estimate. C Correlation between dPRS or PRS and covariate-adjusted BMI. D Receiver operating curves with area under curve (AUC) values for MI using dPRS, PRS, covariates, and a joint model with covariates and dPRS. Models with covariates were fit in the validation set; all evaluation was in the test set (see “Methods”).

