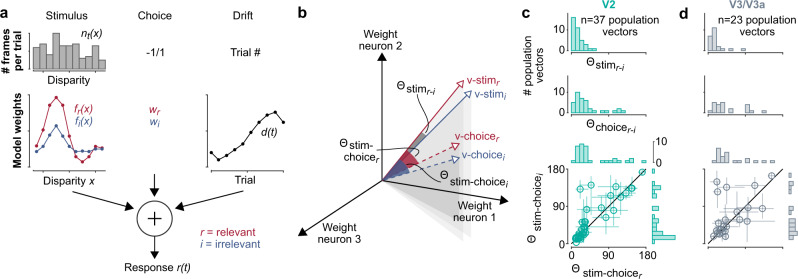
Fig. 4. Stimulus and choice alignment of the population response in visual cortex.
a The encoding model predicts the spike count in a trial from the stimulus-driven response based on its disparity tuning curve and the disparities presented in that trial (left), the choice during that trial (middle), and a drift term to fit any non-stationarity in the recording over time (right). b The stimulus- or choice-driven patterns of neural activity across the recorded neurons can be represented as population vector, with each dimension corresponding to a given neuron’s stimulus- or choice-driven weight estimated from the encoding model. The patterns of activity can then be compared as an angle between the population vectors. c, d Results for populations in V2 and V3/V3a. Top: The population vectors for the relevant and irrelevant stimulus are well aligned across sessions. Middle: the population vectors for the choices when the stimulus was relevant or irrelevant are broadly aligned. Bottom: The angles between the population vectors for the relevant stimulus (v-stimr) and choice (v-choicer or v-choicei) are correlated (r = 0.86, p = 10−10, n = 37 sessions for V2; r = 0.51, p = 0.01, n = 23 sessions for V3/V3a, two-sided Spearman’s rank correlation; error bars are 90% confidence intervals around the median angle, by resampling).

