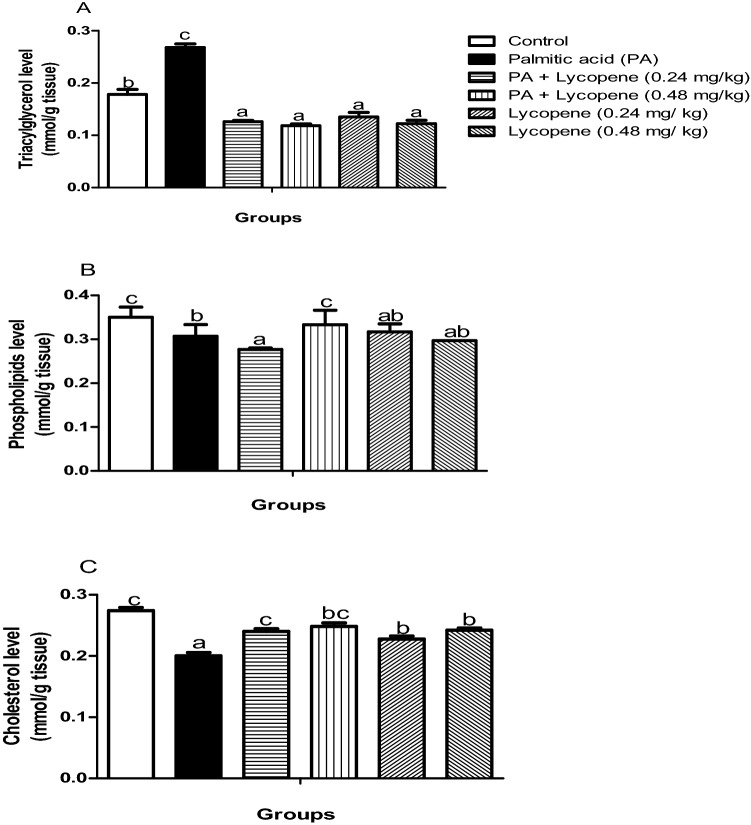
Figure 4.
Effects of lycopene on brain lipid profiles of palmitic acid-induced neuro-inflammation in female rats. Values are expressed as mean ± S.E.M (n = 5). Bars with different letters are statistically distinct (p < 0.05). (A) Triacylglycerol level (B) Phospholipids level (C) Cholesterol level. Data were analysed using SPSS version 20 (IBM SPSS Software, United Kingdom) while the graph was plotted using GraphPad Prism Software, version 6 (San Diego, CA 92,108) https://www.graphpad.com/scientific-software/prism/.

