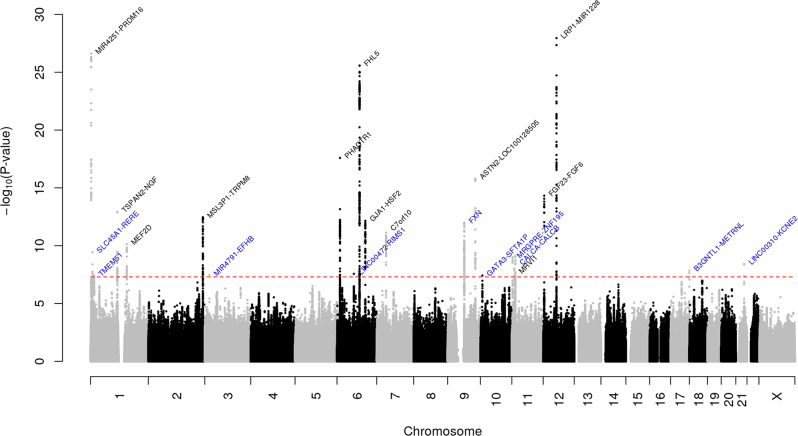
Fig. 1. Manhattan plot of the multiethnic combined (GERA + UKB) GWAS meta-analysis of migraine.
The y-axis represents the –log10(P value); all P values derived from logistic regression model are two-sided. The red dotted line represents the threshold of P = 5 × 10⁻⁸, which is the commonly accepted threshold of adjustments for multiple comparisons in GWAS. Locus names in blue are for the novel loci and the ones in dark are for the previously reported ones.

