Figure 2.
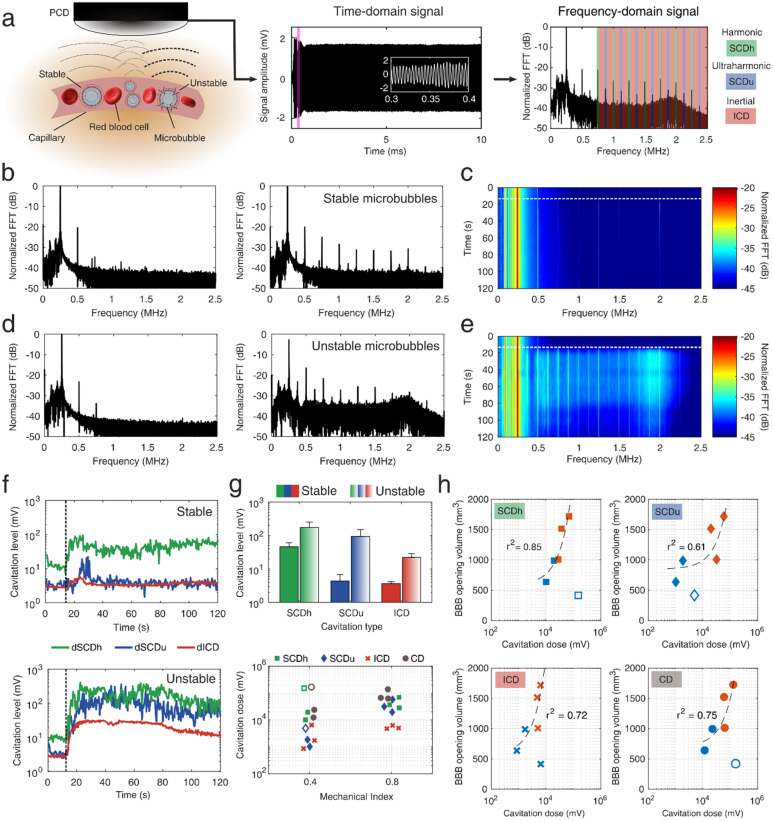
Real-time monitoring of blood–brain barrier opening through passive cavitation detection. (a) Microbubbles exposed to FUS re-radiate their own acoustic emissions which can be captured through a single-element PCD. Microbubbles can oscillate either in a “stable” and recurrent manner (low pressure or MI of 0.4), or in an “unstable” and violent manner (high pressure or MI of 0.8), which may lead to their fragmentation and jet formation. The latter oscillation mode radiates higher amount of acoustic energy. The time-domain signal had duration of 10 ms, recording the microbubble response throughout the therapeutic pulse. White inset corresponds to the purple area in the beginning of the pulse. Time domain signal was converted to the frequency domain by calculating the FFT. Spectral domains containing the harmonics (green areas), ultraharmonics (blue areas), and broadband (red areas) emissions were isolated to calculate the respective cavitation levels and doses. (b) Example spectra before (left) and after (right) the intravenous injection of microbubbles, during FUS treatment at MI of 0.4. (c) Spectrogram including the frequency response throughout the 2-min treatment duration at MI of 0.4. (d) Example spectra before (left) and after (right) the intravenous injection of microbubbles, during FUS treatment at MI of 0.8. (e) Spectrogram including the frequency response throughout the 2-min treatment duration at MI of 0.8. (f) Cavitation levels throughout the FUS treatment at MI of 0.4 (top panel) and 0.8 (bottom panel). Harmonic stable cavitation levels (green line) dominated during treatment at MI of 0.4. Ultraharmonic stable (blue line) and inertial (red line) cavitation levels rose only during treatment at MI of 0.8. (g) Top: average cavitation levels for FUS treatment at MI of 0.4 (filled bars) and 0.8 (patterned bars). Bottom: Harmonic stable, ultraharmonic stable, inertial, and total cavitation dose for FUS treatment at MI of 0.4 and 0.8. (h) Correlation between BBB opening volume and harmonic stable (squares), ultraharmonic stable (diamonds), inertial (crosses), and total (circles) cavitation dose. Light blue and orange symbols denote treatment and MI of 0.4 and 0.8, respectively. Harmonic stable cavitation dose had the highest correlation with the resulting BBB opening volume (r2 = 0.85). Cavitation levels were calculated for each individual therapeutic pulse, while cavitation dose was the sum of all cavitation levels throughout the 2-min FUS treatment. Empty symbols in (g) and (h) correspond to an outlier with low signal-to-noise ratio (SNR ~ 1; NHP 3). Dotted lines in (c), (e) and (f) denote the time point in which microbubbles enter the focal volume, following their intravenous administration at t = 0 s. Data in (g) are presented as mean ± standard deviation (n = 210 pulses after microbubble signal detection). PCD, passive cavitation detector; MI, mechanical index; FFT, fast Fourier transform; dB, decibel; dSCDh, stable cavitation level based on harmonic emissions; dSCDu, stable cavitation level based on ultraharmonic emissions; dICD, inertial cavitation level; SCDh, stable cavitation dose based on harmonic emissions; SCDu, stable cavitation dose based on ultraharmonic emissions; ICD, inertial cavitation dose; CD, total cavitation dose.

