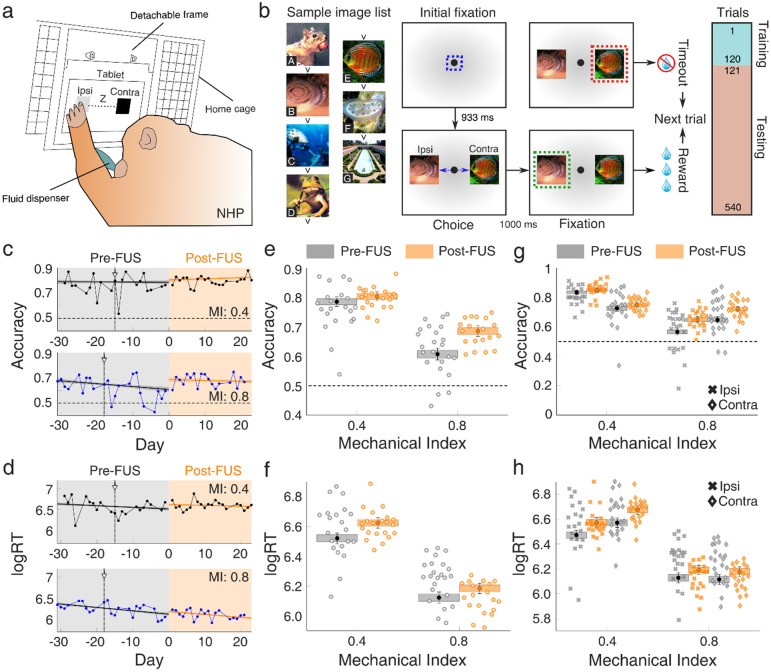
Figure 4.
Cognitive function in non-human primates following focused ultrasound treatment. (a) Inference test setup for the assessment of accuracy and reaction time in a complex visual task. A tablet fixed within a detachable frame was positioned at the home cage of NHPs 3 and 4 on a daily basis. A set of two images was presented in each trial, one at the left (i.e., ipsilateral to the FUS treatment) side and one at the right (i.e., contralateral to the FUS treatment) side. A fluid dispenser provided water as a reward for each correct answer. (b) Inference test design. Two images were randomly selected from a list of 7 images, each carrying a different inference value (A–G had decreasing implicit value; e.g., picture B had a higher implicit value than picture E etc.), and presented on the screen. The set of images was different for each day. Initial fixation was achieved with a point presented at the monitor for 933 ms. The two images were then presented for 1 s. When NHPs selected the correct answer on time, they were rewarded. In contrast, there was no reward for erroneous responses. The first 120 trials constituted the training phase, while the following 420 trials constituted the testing phase. (c) Daily accuracy, for MI of 0.4 (top, NHP 3) and MI of 0.8 (bottom, NHP 4). The mean estimate of the logistic regression for accuracy is plotted with a solid line (black line: pre-FUS; orange line: post-FUS), with shading indicating the 95% confidence interval for the mean. Each data point represents the average accuracy on a given day (n = 540 trials). (d) Daily reaction time, for MI of 0.4 (top, NHP 3) and MI of 0.8 (bottom, NHP 4). The mean estimate of the logistic regression for reaction time is plotted with a solid line (black line: pre-FUS; orange line: post-FUS), with shading indicating the 95% confidence interval for the mean. Each data point represents the average reaction time on a given day (n = 540 trials). (e) Accuracy intercept on day 0 before (gray boxes) and after (orange boxes) FUS treatment at MI of 0.4 and 0.8. (f) Reaction time intercept before (gray boxes) and after (orange boxes) FUS treatment at MI of 0.4 and 0.8. (g) Accuracy intercept on day 0 with ipsilateral (crosses) and contralateral (diamonds) targets, before (gray boxes) and after (orange boxes) FUS treatment at MI of 0.4 and 0.8. (h) Reaction time intercept on day 0 with ipsilateral (crosses) and contralateral (diamonds) targets, before (gray boxes) and after (orange boxes) FUS treatment at MI of 0.4 and 0.8. Gray and orange areas in (c) and (d) represent the period before and after FUS application, respectively. Data in (e), (f), (g), and (h) are presented as boxplots which correspond to estimated performance on day 0. Whiskers represent the 95% confidence interval, whereas boxes represent the 80% confidence interval. Accuracy and reaction rate for each day were the averages of all completed trials. The vertical line in (c) and (d) denotes the day of the pre-FUS MRI. Sample images in (b) were taken from a “free-to-use” collection of stock photos from a CD-ROM acquired in the 90 s. NHP, non-human primate; FUS, focused ultrasound; Ipsi, ipsilateral (i.e., left) targets; Contra, contralateral (i.e., right) targets; logRT, natural logarithm of reaction time.

