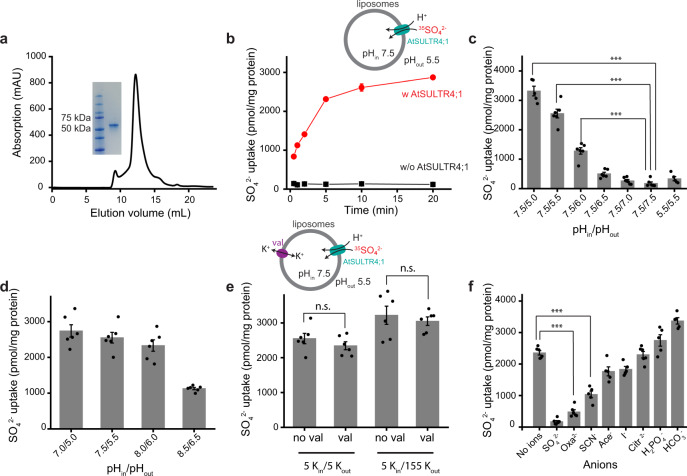
Fig. 1. Functional characterization of AtSULTR4;1.
a Purification of AtSULTR4;1. The curve shows the size-exclusion chromatography profile of the purified protein, solubilized in detergent LMNG; the inset shows the SDS-PAGE profile of the purified protein. b Time-dependent SO42− transport by AtSULTR4;1. Radiolabeled SO42− is used to monitor sulfate influx. Red points represent proteoliposomes with reconstituted AtSULTR4;1, and black points represent liposomes without protein. Each data point is the average of 6 repeats from 2 batches of liposomes independently prepared. Error bars indicate the standard error of the mean (s.e.m.) of the data points. c, d pH-dependence of SO42− transport. The intra- and extra-vesicular pH values (pHin and pHout, respectively) of each setup are indicated below the columns. For all column charts, a scatter plot of individual data points is overlaid onto each column. The height of each column represents the average of 5 or 6 repeats of experiments from 2 batches of liposomes independently prepared (in c and d, n = 5 for 5.5/5.5 and 7.5/5.0, and n = 6 for others). Error bars indicate s.e.m. of the average. Two-tailed Student’s t test was applied to selected data. *** indicates p < 0.0001. Exact p values can be found in the Source Data file. e Voltage-dependence of SO42− transport. n.s. indicates that data are not significantly different. n = 6 for all columns. f Competition of SO42− transport by different anions. The pH values are 7.5/5.5 pHin/pHout for these experiments. Anions are added at 50-fold the concentration of the radiolabeled SO42−. n = 5 for SCN−, Ace−, I−, HPO42−, and HCO3−, and n = 6 for others.

