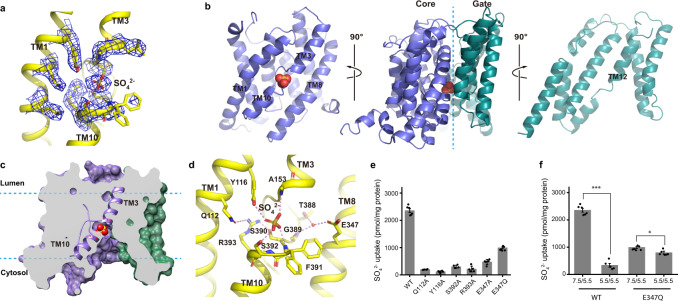
Fig. 3. AtSULTR4;1 substrate binding site.
a Density of the bound SO42− and of residues nearby. Residues and SO42− are shown as sticks and the density is shown as blue mesh. b Cut-open view of the core and gate domains (violet and teal, respectively) of the TM domain of AtSULTR4;1. The two domains are rotated 90o as indicated to reveal their contact surface and the substrate-binding site in the core domain (left). c Cutaway view of the TM domain. Violet and teal surfaces indicate the core and gate domains, respectively. TM3 and TM10 are highlighted in cartoon representation. d Coordination of SO42− in the binding site. Direct interactions are marked with dashed lines. e Mutational studies of residues in the substrate-binding site. f pH dependence of AtSULTR4;1 WT and E347Q mutant. The pHin/pHout conditions for each test are marked below the columns. The height of the columns represents the average of 5–6 repeats from 2 batches of liposomes independently prepared. n = 5 for Q112A, Y116A, S392A, E347A, and WT 5.5/5.5, and n = 6 for all others. Error bars indicate s.e.m. of the average. A two-tailed Student’s t test was applied to selected data. *** indicates p < 0.0001; * indicates p < 0.01. Exact p values can be found in the Source Data file.

