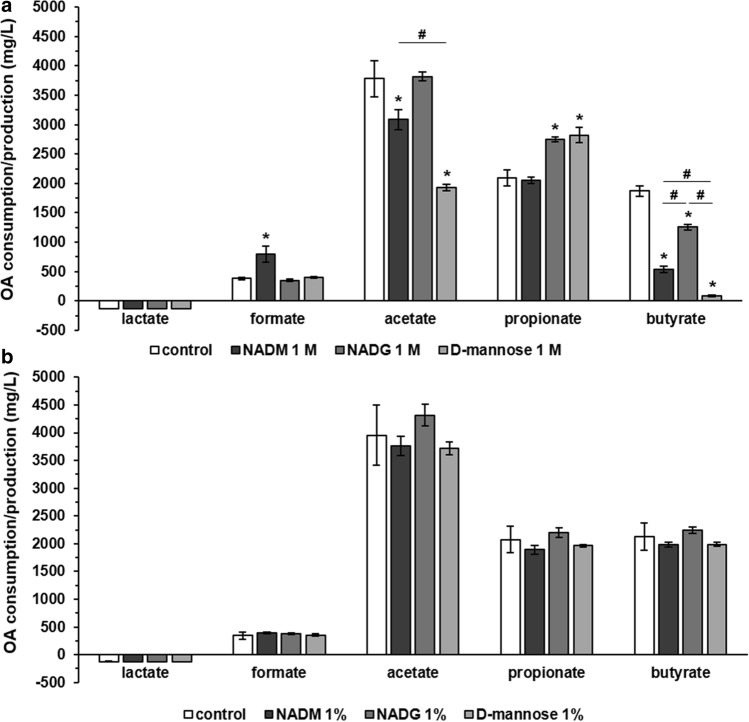
Figure 3.
Comparison of the effects of repeated rinsing with NADM, NADG or d-(+)-mannose on multi-species biofilm organic acid production/consumption. Organic acid levels detected in the supernatants of substrate-treated multi-species biofilms are shown as mean ± SD (n = 3) values (mg/L). Values > 0 mg/L represent a net organic acid production, values < 0 mg/L represent a net organic acid consumption. Substrates were dissolved in PBS at a concentration of 1 M (panel a) or ~ 0.05 M (1%(w/v)) (panel b) (corresponding molar concentrations: 0.045 M (NADM and NADG) and 0.056 M (d-(+)-mannose)). Statistically significantly different values when compared to the control (PBS) are marked with ‘*’ (P < 0.05, ANOVA + Dunnett’s correction for simultaneous hypothesis testing), statistically significantly different values between two treatment conditions, which were only considered to be relevant if each condition was also significantly different from the control condition, are marked with ‘#’ (P < 0.05, ANOVA + Tukey’s correction for simultaneous hypothesis testing for comparisons between 3 substrates, unpaired two-tailed t-test for comparisons between 2 substrates). OA: organic acid; NADM: N-acetyl-d-mannosamine; NADG: N-acetyl-d-glucosamine.

