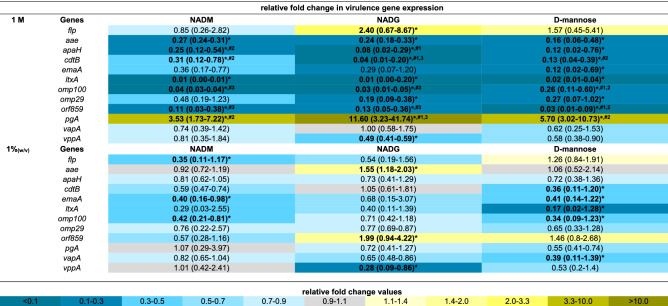
Table 1.
Comparison of the effects of repeated multi-species biofilm rinsing with NADM, NADG or d-(+)-mannose on A. actinomycetemcomitans virulence gene expression.
Fold changes in virulence gene expression were determined relative to the control condition through the 2−ΔΔCt method and are shown as the geometric mean (C.I.) (n = 3) of the 2−ΔΔCt values. All substrates were dissolved in PBS at 1 M (upper part) or ~ 0.05 M (1%(w/v)) (lower part) (0.045 M (NADM and NADG) and 0.056 M (d-(+)-mannose)). Values between 0 and 1 represent relative downregulation, values > 1 relative upregulation. Statistically significantly values relative to the control (PBS) that are < 0.5 (> twofold downregulated) or > 1.5 (> 1.5-fold upregulated) are considered biologically relevant and shown in bold and marked with ‘*’ (P < 0.05, ANOVA + Dunnett’s correction for simultaneous hypothesis testing). For such values, statistically significant differences between two treatment conditions are marked with ‘#1’ (vs. NADM), ‘#2’ (vs. NADG), ‘#3’ (vs. d-(+)-mannose) and shown in bold (P < 0.05, ANOVA + Tukey’s correction for simultaneous hypothesis testing for comparisons between 3 substrates, unpaired two-tailed t-test for comparisons between 2 substrates). Statistically significantly different values between treatment conditions were only considered relevant if each condition was also significantly different from the control condition and only such differences are indicated. Color code: magnitude of the fold change in gene expression relative to the control. NADM: N-acetyl-d-mannosamine; NADG: N-acetyl-d-glucosamine; C.I.: 95% confidence interval.

