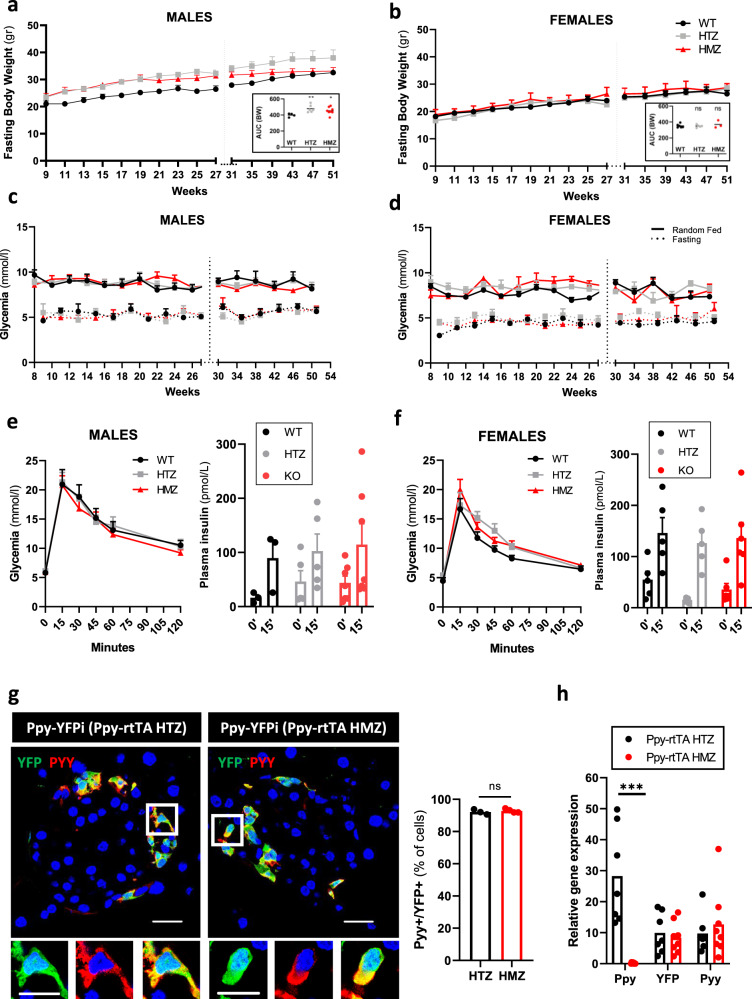
Fig. 7. Ppy inactivation has no impact on body weight and glycemia.
Fasting body weight curves in wild-type (black), Ppy-rtTA HTZ (gry) and Ppy-rtTA HMZ (red) males (a) and females (b) mice. Area under de curve (AUC) of each genotype is shown in the bottom right panel. Glycemia curves in wild-type (black), Ppy-rtTA HTZ (gray) and Ppy-rtTA HMZ (red) males (c) and females (d) mice. Solid line represents random fed glycemia values, dashed line represents fasting glycemia values. Body weight and glycemia values were obtained from the same mice. Males: WT, n = 4 mice; HTZ, n = 6 mice; HMZ; n = 8 mice. Females: WT, n = 6 mice; HTZ, n = 5 mice; HMZ, n = 3 mice. Intraperitoneal glucose tolerance test to 1-year-old wild-type (black), Ppy-rtTA HTZ (gray) and Ppy-rtTA HMZ (red) males (e, left panel) and females (f, left panel) mice. Glucose-stimulated insulin secretion in vivo to 1-year-old wild-type (black), Ppy-rtTA HTZ (gray) and Ppy-rtTA HMZ (red) males (e, right panel) and females (f, right panel) mice. Males: WT, n = 3 mice; HTZ, n = 6 mice; HMZ; n = 8 mice. Females: WT, n = 6 mice; HTZ, n = 5 mice; HMZ, n = 6 mice. g Most of the YFP-labeled γ-cells express also Pyy. Percentage of YFP-tracked Ppy-expressing cells that co-express Pyy in Ppy-rtTA HTZ (n = 3 mice; 1522 Pyy+YFP+ out of 1653 YFP+ cells scored) or Ppy-rtTA HMZ (n = 4 mice; 1973 Pyy+YFP+ out of 2118 YFP+ cells scored) mice. h qPCR of Ppy, YFP and Pyy in FAC-sorted YFP+ cells of Ppy-rtTA HTZ (n = 7 mice) and HMZ (n = 8 mice) mice. Data are shown as normalized ct values relative to β-actin. Two-tailed Mann–Whitney test (ns p > 0.05; *p ≤ 0.05; **p ≤ 0.01; ***p ≤ 0.001), Ppy expression in Ppy-rtTA HTZ versus HMZ: P value = 0.0006; YFP expression Ppy-rtTA HTZ versus HMZ: P value = 0.6943; Ppy expression Ppy-rtTA HTZ versus HMZ: P value = 0.6126. Only the significant statistical differences are indicated in the figure. Region of the pancreas: Ventral. Scale bar: 20 μm (islet) or 10 μm (cell). Data are presented as mean values ± s.e.m. Source data are provided as Source Data file (Supplementary Tables t, u).

