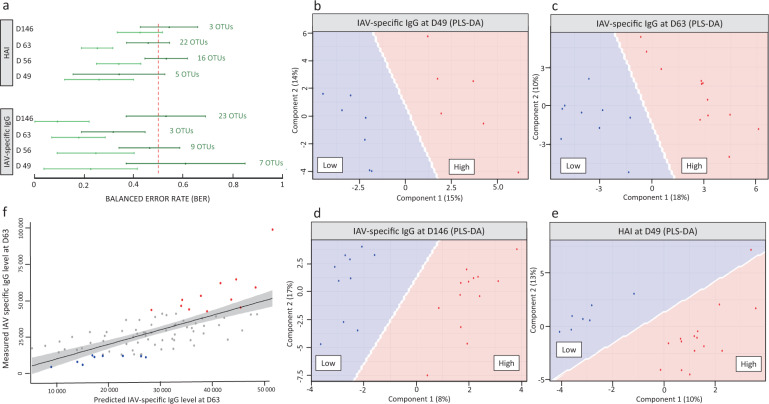
Fig. 7. Predictive capacity of OTUs in pre-vaccination D28 fecal microbiota for vaccine response measured by IAV-specific IgG and HAI.
a Comparison of the prediction yielded by the OTU subsets found at each time point for each vaccine response phenotype (sPLS-DA, dark green line, indication of the number of OTUs selected for each prediction) and by the combined set of 81 OTUs (PLS-DA, light green line). The BER estimations are represented by their 95% confidence intervals, with their means ± 2 standard deviations. b–e Projection of the groups of extreme responders to the influenza vaccine as measured by IAV-specific IgG at b D49, c D63, d D146, and e HAI titers at D49, obtained with a PLS-DA implemented with the combined set of 81 candidate predictive OTUs. Samples are classified as low responders (blue dots) or high responders (red dots). Corresponding sPLS-DA and PLS-DA data are available in Supplementary Table 4 and in Supplementary Data 1. f Plot of measured vs. predicted IAV-specific IgG titers at D63 from a regression model. Predicted values were estimated with PLS analysis based on the counts of the combined set of 81 OTUs applied to the population of all vaccinated piglets that had both a characterized fecal microbiota at D28 and a measured titer of IAV-specific IgG at D63 (n = 86). Low vs. high responders for IAV-specific IgG at D63 are represented with blue and red dots, respectively; all other animals are represented by gray dots.

