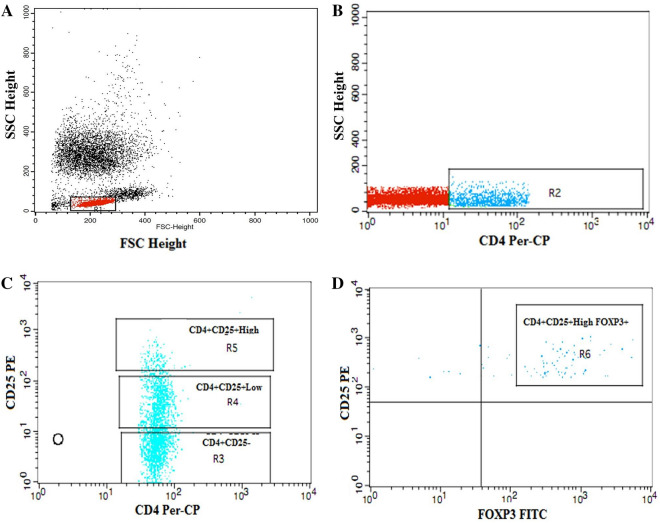
Figure 1.
Flow cytometric detection of regulatory T cells. (A) The lymphocyte population was defined on forward, and side scatter histogram (R1). (B) The expression of CD4 on the lymphocytes population was detected, then CD4+ cells were gated for further analysis of CD25. (C) Three gates were drown to define CD4+CD25- cells, CD4+CD25+low cells and CD4+CD25+high cells. (D) The percentage of CD4+CD25+highFoxp3+cells (regulatory T cells) was then assessed.

