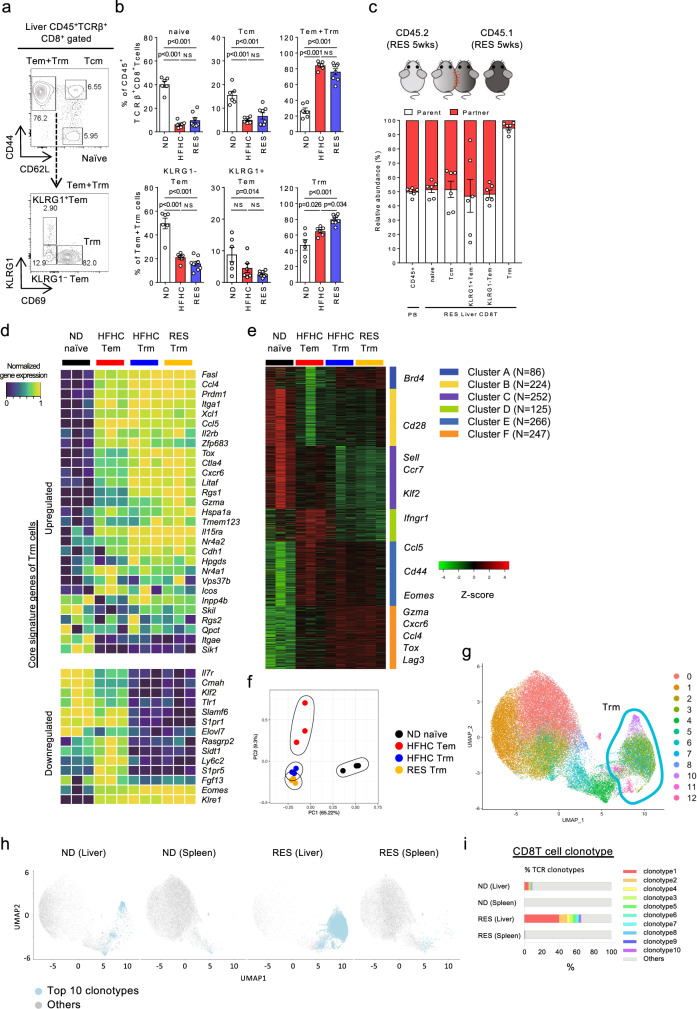
Fig. 4. Characteristics of CD8+ Trm cells in NASH and NASH resolution livers.
a Representative CD44/CD62L staining of CD45+TCRβ+NK1.1−CD8α+ gated liver MNCs (upper) and KLRG1/CD69 staining of CD45+TCRβ+NK1.1−CD8α+CD44+CD62L− gated (Tem + Trm) liver MNCs (lower) of RES (5 weeks) mice. b Frequency of each CD8+ T cell subset in CD45+ liver MNCs derived from the indicated groups of mice (n = 6 mice for ND and HFHC groups, and n = 8 mice for RES group). Data are presented as mean ± SEM. One-way ANOVA with Tukey’s multiple comparisons post-hoc test was applied. c Relative abundance of partner or parent cells in the blood and liver MNCs of mice two weeks following the parabiosis surgery between Ly5.2+ RES (5 weeks) mice and Ly5.1+ RES (5 weeks) mice (n = 6 pairs). Data are presented as mean ± SEM. d–f Bulk RNA-seq analysis of isolated liver naïve CD8+ T cells from ND mice (ND naïve; n = 3), CD8+ Tem cells from HFHC mice (HFHC Tem; n = 3), CD8+ Trm cells from HFHC mice (HFHC Trm; n = 3), and CD8+ Trm cells from RES (5 weeks) mice (RES Trm; n = 3). d Heat map of key upregulated (upper) or down-regulated (lower) genes characteristic of Trm. e K-means clustering analysis. Most variable 1200 genes were clustered to six groups. Featured genes determined by scRNA-seq were shown. f PCA analysis plot of top 1000 genes. g–i ScTCR-seq analysis of combined liver or spleen CD8 T cells derived from ND and RES (5 weeks) mice. g UMAP projection of combined liver and spleen CD8+ T cells (n = 53,659) derived from ND(Liver), ND (Spleen), RES (Liver), and RES (Spleen) mice. Green circle highlights clusters of Trm cells. h UMAP projection and i percentage of top 10 and other TCR clonotypes in each cell subset. Source data are provided as a Source data file.

