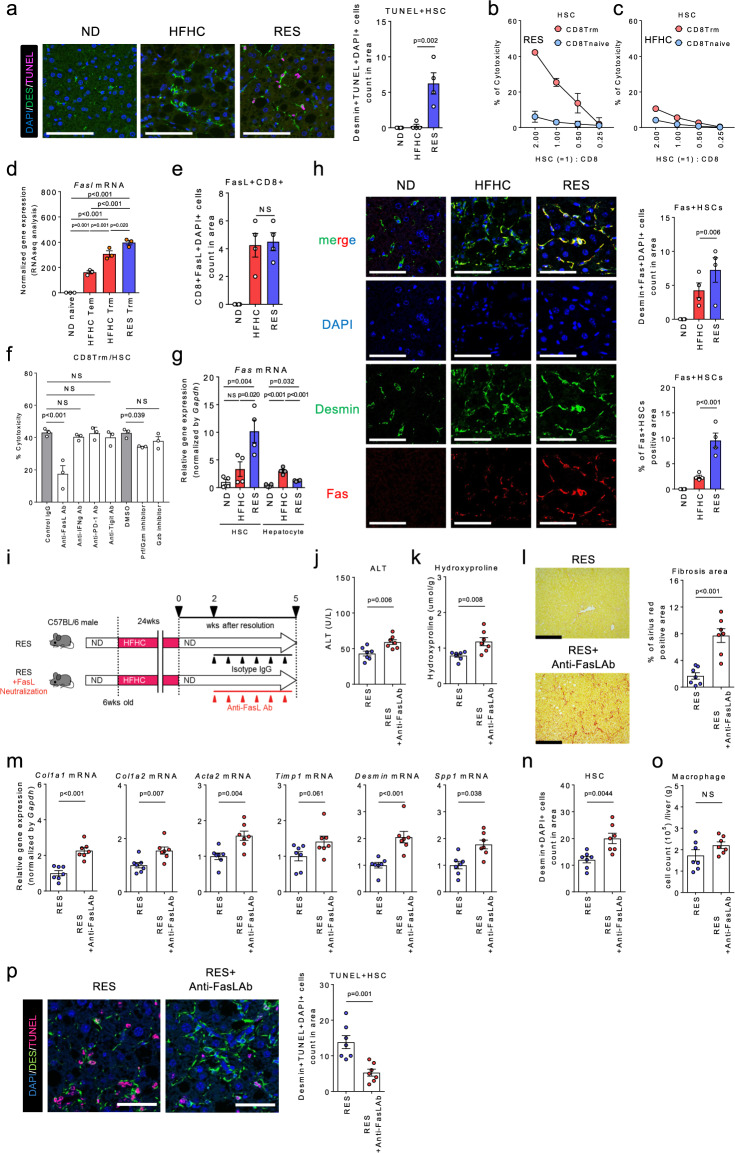
Fig. 8. CD8+ Trm cells induce HSCs apoptosis in a FasL dependent manner in NASH resolution.
a (left) Representative fluorescent photomicrographs of liver sections from ND, HFHC, and RES (3 weeks) mice stained with anti-desmin Ab (green) and TUNEL (pink). Scale bars: 50 µm. (right) Count of TUNEL positive HSCs in unit area of liver section (n = 4 mice per group). b, c Percent cytotoxicity of HSCs by CD8 Trm (red) or CD8 T naive (blue) isolated from RES 5 weeks mice (b) or HFHC mice (c) (n = 3 biologically independent samples per group). d Fasl mRNA levels in sorted CD8+ T cell subsets (n = 3 mice per group). e Count of FasL positive CD8+ T cells in unit area of liver section (n = 4 mice per group). f Percent cytotoxicity of HSCs co-cultured with CD8+ Trm cells in the presence of the indicated apoptosis inhibitors for 8 h (n = 3 biologically independent samples per group). g Fas mRNA levels in isolated HSCs and hepatocytes of the indicated mice (n = 4 mice per group). h (left) Representative fluorescent photomicrographs of liver sections stained with DAPI (blue), anti-desmin Ab (green), and anti-Fas (red). Scale bars: 50 µm. (right upper) Count of Fas positive HSCs in unit area of liver section (n = 4 mice per group). (right lower) Positive area of Fas positive HSCs in unit area of liver section. i Study design: resolution induced mice were intraperitoneally injected with anti-FasL antibody (RES + FasL neutralization group) or the isotype control (RES group) once every 3 days for 3 weeks starting at week 2 following diet switch (n = 7 mice per group). j Serum ALT levels. k Hydroxyproline levels. l Representative photomicrographs (left) and positive area (right) of Sirius Red staining of liver sections. Scale bars: 200 µm. m Fibrosis associated genes (Col1a1, Col1a2, Acta2, Timp1, Desmin, Spp1) mRNA levels. n HSCs count in unit area of liver section. o Number of CD45+CD11b+ CD11c− macrophages in CD45+ liver MNCs. p (left) Representative fluorescent photomicrographs of liver sections stained with DAPI (blue), anti-desmin Ab (green), and TUNEL (pink). Scale bars: 50 µm. (right) Count of TUNEL positive HSCs in unit area of liver section. Data are presented as mean ± SEM. One-way ANOVA with Tukey’s multiple comparisons post-hoc test (a, d–h) or two-sided unpaired Student’s t test (j–p) was applied. Source data are provided as a Source data file.

