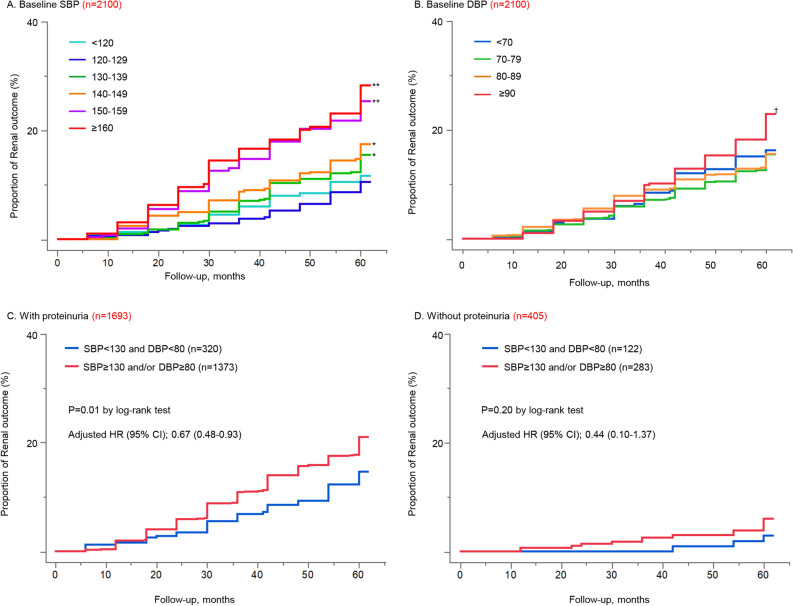
Figure 1.
Kaplan–Meier analyses for renal outcome based on baseline SBP and DBP levels (A,B), and stratified by the presence or absence of baseline proteinuria (C,D). (A) Analyses of baseline SBP levels (6 groups); The SBP 120–129 mmHg group had the lowest risk of the renal outcome. (B) Analyses of baseline DBP levels (4 groups); the risk of renal outcome significantly increased only in the DBP ≥ 90 mmHg group compared to the DBP 70–79 mmHg group. *p < 0.05 vs SBP 120–129 mmHg (Log-rank), **p < 0.001 vs SBP 120–129 mmHg (Log-rank), †p < 0.05 vs DBP 70–79 mmHg (Log-rank). (C) Patients with proteinuria; proteinuria was defined as ≥ ± by dipstick test. The baseline BP < 130/80 mmHg group significantly reduced the risk of the renal outcome compared to the other. (D) Patients without proteinuria; No significant difference was found in renal outcome. SBP systolic blood pressure, DBP diastolic blood pressure, BP blood pressure, HR hazard ratio. Hazard ratios have been adjusted for nine prespecified baseline factors (age, sex, body mass index, smoking, presence of diabetes mellitus, presence of dyslipidemia, presence of hyperuricemia, use of anti-hypertensive medication and intervention arm).

