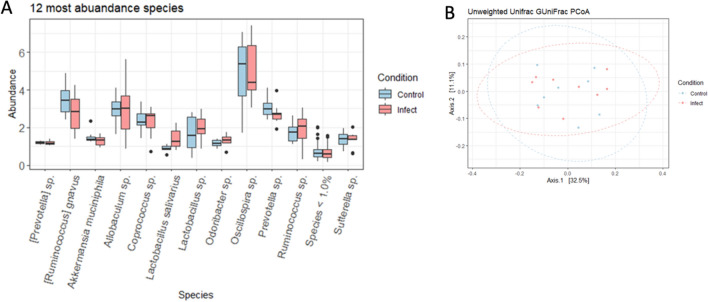
Figure 6.
(A) Relative abundance in caecal samples of infected and control animals. Prior to overall relative abundance analysis, data undergoes CSS normalisation and abundances were converted into percentages before sorting at species level. OTUs with similar species identification were pooled together for relative abundance analysis. Species with relative abundance < 1.0% were grouped together. (B) Beta diversity using Unweighted UniFrac distance (PERMANOVA of LMM condition P = 0.90, batch effect P < 0.05). Prior to beta diversity analysis, OTUs < 0.01% were judged to be insignificant not included in the overall analysis.

