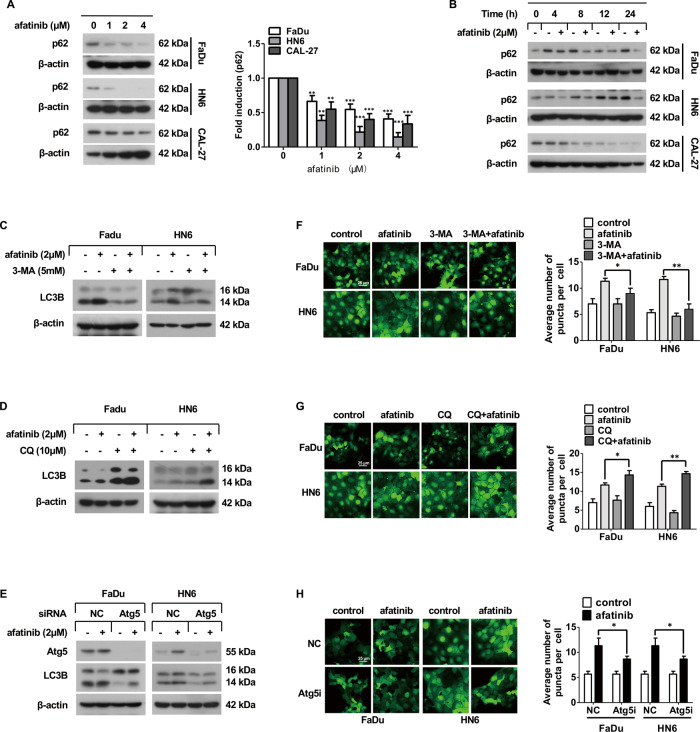
Fig. 2. Afatinib triggers autophagic flux in human HNSCC cells.
A Western blot analysis of p62 expression in FaDu, HN6, and CAL-27 cells after treatment with 0, 1, 2, and 4 μM afatinib for 24 h. The intensity of p62 was normalized to β-actin, then the fold induction (treated/untreated control) was calculated (**p < 0.01, ***p < 0.001 vs. untreated control). B Western blot analysis of p62 expression in FaDu, HN6, and CAL-27 cells after treatment with 2 μM afatinib for 0, 4, 8, 12, and 24 h. C, D FaDu and HN6 cells were pretreated with 5 mM 3-MA for 2 h (C) or with 10 μM CQ for 30 min (D), and then co-incubated with 2 μM afatinib for another 24 h. The expression of LC3B was detected by western blot analysis. E FaDu and HN6 cells were seeded in 6-well plates and transfected with control and Atg5 siRNA on the second day. After 48 h transfection, cells were exposed to 2 μM afatinib for 24 h. The expression of Atg5 and LC3B was detected by western blot analysis. F, G FaDu-EGFP-LC3B and HN6-EGFP-LC3B cells were pretreated with 5 mM 3-MA for 2 h (F) or with 10 μM CQ for 30 min (G), and then co-incubated with 2 μM afatinib for another 24 h. Thereafter, cells were fixed, imaged, and EGFP-LC3B fluorescent spots were quantified. H FaDu-EGFP-LC3B and HN6-EGFP-LC3B cells were transfected with control and Atg5 siRNA for 48 h. Then, cells were exposed to 2 μM afatinib for 24 h and the EGFP-LC3B fluorescent spots were determined using a laser scanning confocal microscope. Scale bar, 25 µm. All data are presented as the mean ± SD from three independent experiments. *p < 0.05, **p < 0.01.

