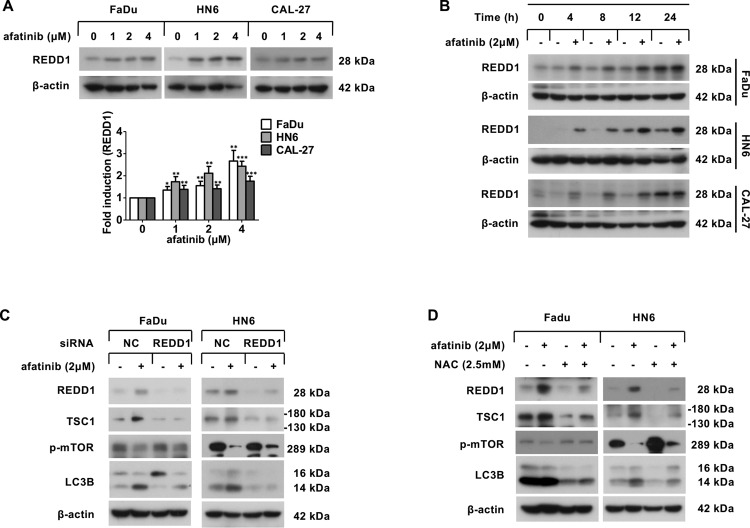
Fig. 4. Afatinib induces autophagy through ROS-dependent upregulation of REDD1.
A Western blot analysis of REDD1 expression in FaDu, HN6, and CAL-27 cells after treatment with 0, 1, 2, and 4 μM afatinib for 24 h. The intensity of REDD1 was normalized to β-actin, then the fold induction (treated/untreated control) was calculated (*p < 0.05, **p < 0.01, ***p < 0.001 vs. untreated control). B Western blot analysis of REDD1 expression in FaDu, HN6, and CAL-27 cells after treatment with 2 μM afatinib for 0, 4, 8, 12, and 24 h. C FaDu and HN6 cells were transfected with control and REDD1 siRNA. Forty-eight hours later, cells were incubated with 2 μM afatinib for 24 h. The level of REDD1, TSC1, p-mTOR, and LC3B was measured by western blot analysis. D FaDu and HN6 cells were pretreated with 2.5 mM NAC for 30 min followed by co-incubation with 2 μM afatinib for another 24 h, and then the level of REDD1, TSC1, p-mTOR, and LC3B was measured by western blot analysis.

