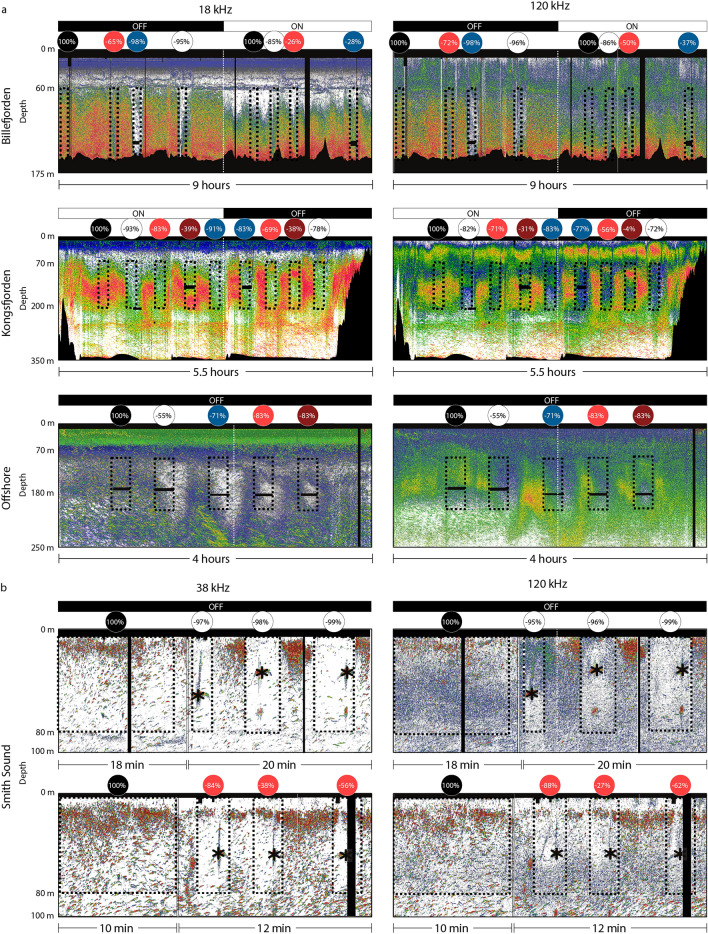
Figure 4.
Volume backscattering strength echograms (Sv) from the EK60 echosounder during (a) the Svalbard and (b) Newfoundland experiments. The dashed rectangles represent each deployment, and the first rectangle of each echogram represents the control deployment. The corresponding circles on top are coloured according to the filter being used and indicate the percentage reduction in area backscattering coefficient (sa). Black and white bars on top of the echograms indicate when the ship's lights were on and off. Black areas represent areas removed from the analyses because of noise or depths below the seafloor. The asterisks indicate the location of the baited camera during the Newfoundland experiment. Note that the signal from the camera was removed from the analyses. Higher Sv threshold is − 50 dB for all echograms and lower Sv threshold is − 90 dB for Billefjorden and Newfoundland, − 95 dB for Kongsfjorden, and − 110 dB for the offshore echograms.

