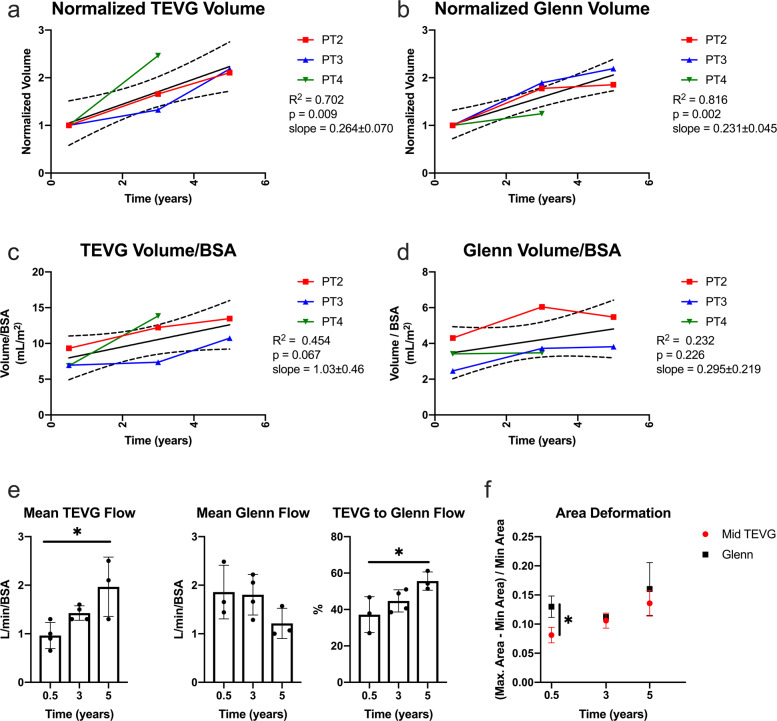
Fig. 3. TEVG growth analysis: serial MRI data from the clinical trial.
a TEVG volume normalized to the size of the graft at 6 months. b Glenn volume normalized to the size of the vessel at 6 months. c Change in TEVG volume over time normalized to body surface area. d Change in Glenn volume over time normalized to body surface area. e Mean volumetric flow through the TEVG and Glenn normalized to body surface area. Error bars represent standard deviation. f Change in luminal cross-sectional over one cardiac cycle evaluated longitudinally by MRI. (n = 4 at 0.5 and 3 year time points, n = 3 at 5 year time point) Error bars represent standard deviation. TEVG tissue-engineered vascular graft, Glenn superior vena cava to pulmonary artery connection, BSA body surface area.

